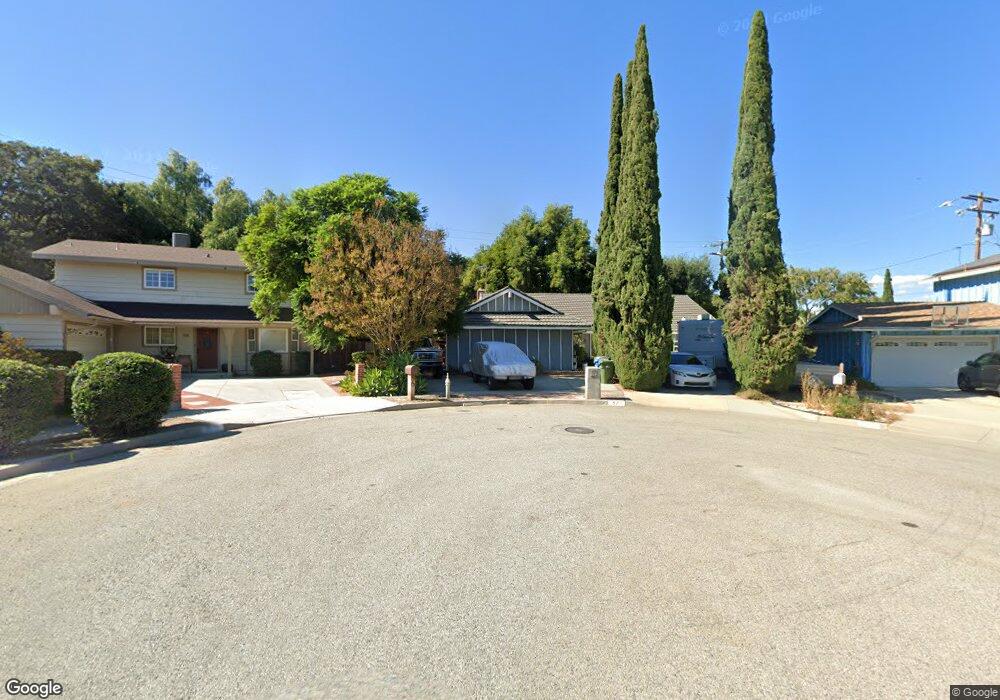
87 Marvin Ct Simi Valley, CA 93065
West Simi Valley NeighborhoodEstimated Value: $717,000 - $898,000
3
Beds
2
Baths
1,544
Sq Ft
$518/Sq Ft
Est. Value
About This Home
This home is located at 87 Marvin Ct, Simi Valley, CA 93065 and is currently estimated at $799,415, approximately $517 per square foot. 87 Marvin Ct is a home located in Ventura County with nearby schools including Madera Elementary School, Sinaloa Middle School, and Royal High School.
Ownership History
Date
Name
Owned For
Owner Type
Purchase Details
Closed on
Dec 29, 2015
Sold by
Macnamara Glenda Suatengco and Macnamara John Alan
Bought by
Macnamara Glenda Suatengco and Macnamara John Alan
Current Estimated Value
Home Financials for this Owner
Home Financials are based on the most recent Mortgage that was taken out on this home.
Original Mortgage
$287,000
Interest Rate
3.94%
Mortgage Type
New Conventional
Purchase Details
Closed on
Apr 20, 2012
Sold by
Macnamara Glenda
Bought by
Macnamara Glenda and Macnamara John
Home Financials for this Owner
Home Financials are based on the most recent Mortgage that was taken out on this home.
Original Mortgage
$280,000
Interest Rate
3.9%
Mortgage Type
New Conventional
Purchase Details
Closed on
Nov 2, 2005
Sold by
Macmacnamara John Mac
Bought by
Macmacnamara Glenda Mac
Home Financials for this Owner
Home Financials are based on the most recent Mortgage that was taken out on this home.
Original Mortgage
$262,000
Interest Rate
6.99%
Mortgage Type
Purchase Money Mortgage
Create a Home Valuation Report for This Property
The Home Valuation Report is an in-depth analysis detailing your home's value as well as a comparison with similar homes in the area
Home Values in the Area
Average Home Value in this Area
Purchase History
| Date | Buyer | Sale Price | Title Company |
|---|---|---|---|
| Macnamara Glenda Suatengco | -- | Title 365 | |
| Macnamara Glenda | -- | Advantage Title | |
| Macmacnamara Glenda Mac | -- | United Title Company Ventura |
Source: Public Records
Mortgage History
| Date | Status | Borrower | Loan Amount |
|---|---|---|---|
| Closed | Macnamara Glenda Suatengco | $287,000 | |
| Closed | Macnamara Glenda | $280,000 | |
| Closed | Macmacnamara Glenda Mac | $262,000 |
Source: Public Records
Tax History
| Year | Tax Paid | Tax Assessment Tax Assessment Total Assessment is a certain percentage of the fair market value that is determined by local assessors to be the total taxable value of land and additions on the property. | Land | Improvement |
|---|---|---|---|---|
| 2025 | $3,274 | $238,207 | $83,362 | $154,845 |
| 2024 | $3,274 | $233,537 | $81,728 | $151,809 |
| 2023 | $3,075 | $228,958 | $80,125 | $148,833 |
| 2022 | $3,038 | $224,469 | $78,554 | $145,915 |
| 2021 | $2,993 | $220,068 | $77,014 | $143,054 |
| 2020 | $2,917 | $217,813 | $76,225 | $141,588 |
| 2019 | $2,780 | $213,543 | $74,731 | $138,812 |
| 2018 | $2,741 | $209,357 | $73,266 | $136,091 |
| 2017 | $2,669 | $205,253 | $71,830 | $133,423 |
| 2016 | $2,544 | $201,229 | $70,422 | $130,807 |
| 2015 | $2,478 | $198,208 | $69,365 | $128,843 |
| 2014 | $2,429 | $194,327 | $68,007 | $126,320 |
Source: Public Records
Map
Nearby Homes
- 32 W Bonita Dr
- 60 Marvin Ct
- 19 La Paz Ct
- 90 La Paz Ct
- 1826 Winterdew Ave
- 1898 Summertime Ave
- 1430 Vaquero Dr
- 101 Red Brick Dr Unit 5
- 118 Red Brick Dr Unit 1
- 105 Red Brick Dr Unit 2
- 2017 Lysander Ave
- 1100 N Country Club Dr
- 1743 Duskwood Way
- 272 Twilight Glen Ln
- 1868 Day Lily Ln
- 2164 Athens Ave
- 195 Tierra Rejada Rd Unit 197
- 195 Tierra Rejada Rd Unit 180
- 195 Tierra Rejada Rd Unit 204
- 195 Tierra Rejada Rd Unit 29
- 61 Marvin Ct
- 86 Marvin Ct
- 1562 Branch Ave
- 1538 Branch Ave
- 70 W Bonita Dr
- 1512 Branch Ave
- 1586 Branch Ave
- 78 W Bonita Dr
- 39 Marvin Ct
- 1492 Branch Ave
- 38 Marvin Ct
- 1468 Branch Ave
- 1452 Branch Ave
- 1561 Branch Ave
- 1587 Branch Ave
- 18 W Bonita Dr
- 1541 Branch Ave
- 1430 Branch Ave
- 1527 Los Amigos Ave
- 71 W Bonita Dr
Your Personal Tour Guide
Ask me questions while you tour the home.