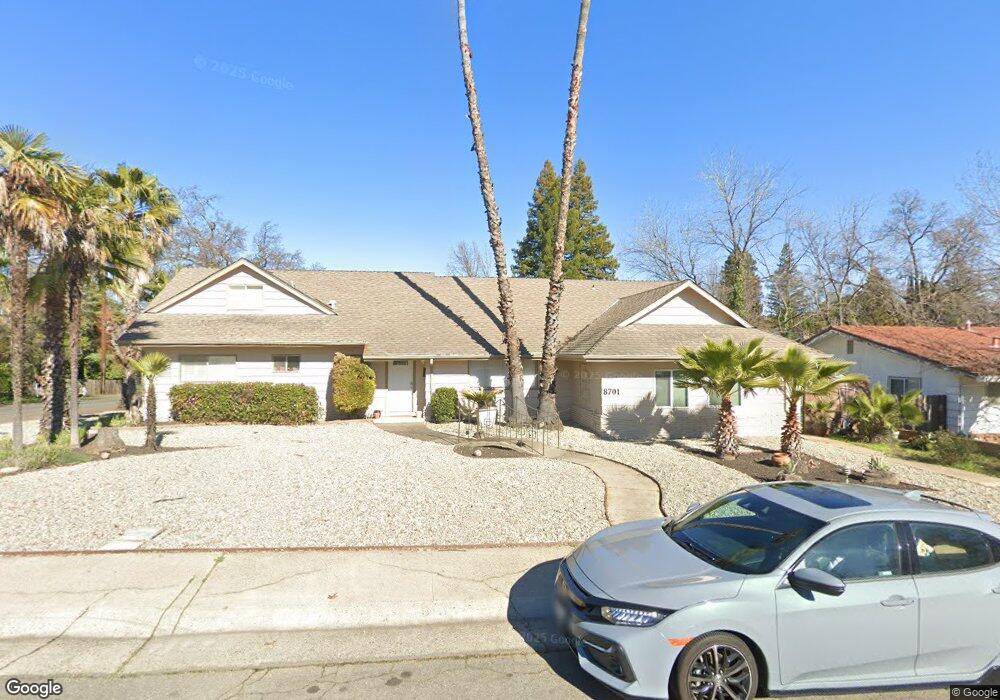
8701 El Chapul Way Fair Oaks, CA 95628
Estimated Value: $764,860 - $929,000
1
Bed
3
Baths
--
Sq Ft
10,019
Sq Ft Lot
About This Home
This home is located at 8701 El Chapul Way, Fair Oaks, CA 95628 and is currently estimated at $818,215. 8701 El Chapul Way is a home located in Sacramento County with nearby schools including Earl Legette Elementary School, Andrew Carnegie Middle School, and Bella Vista High School.
Ownership History
Date
Name
Owned For
Owner Type
Purchase Details
Closed on
Jan 22, 2025
Sold by
25 And Holding Llc
Bought by
Tate Eric and Tate Valerie
Current Estimated Value
Purchase Details
Closed on
Dec 10, 2024
Sold by
Velocity Investments Llc
Bought by
25 And Holding Llc
Purchase Details
Closed on
Aug 13, 2024
Sold by
Walker Family Trust and Walker Wendy
Bought by
Velocity Investments Llc
Home Financials for this Owner
Home Financials are based on the most recent Mortgage that was taken out on this home.
Original Mortgage
$597,380
Interest Rate
6.95%
Mortgage Type
Construction
Purchase Details
Closed on
Jul 30, 2023
Sold by
Arthur H Yates H and Arthur Bonita J
Bought by
Walker Family Trust and Walker
Create a Home Valuation Report for This Property
The Home Valuation Report is an in-depth analysis detailing your home's value as well as a comparison with similar homes in the area
Home Values in the Area
Average Home Value in this Area
Purchase History
| Date | Buyer | Sale Price | Title Company |
|---|---|---|---|
| Tate Eric | -- | None Listed On Document | |
| Tate Eric | -- | None Listed On Document | |
| 25 And Holding Llc | -- | None Listed On Document | |
| 25 And Holding Llc | -- | None Listed On Document | |
| Velocity Investments Llc | $650,000 | Old Republic Title | |
| Walker Family Trust | -- | None Listed On Document |
Source: Public Records
Mortgage History
| Date | Status | Borrower | Loan Amount |
|---|---|---|---|
| Previous Owner | Velocity Investments Llc | $597,380 |
Source: Public Records
Tax History Compared to Growth
Tax History
| Year | Tax Paid | Tax Assessment Tax Assessment Total Assessment is a certain percentage of the fair market value that is determined by local assessors to be the total taxable value of land and additions on the property. | Land | Improvement |
|---|---|---|---|---|
| 2025 | $7,556 | $650,000 | $200,000 | $450,000 |
| 2024 | $7,556 | $615,000 | $200,000 | $415,000 |
| 2023 | $5,522 | $320,700 | $147,347 | $173,353 |
| 2022 | $5,429 | $314,412 | $144,458 | $169,954 |
| 2021 | $5,263 | $308,248 | $141,626 | $166,622 |
| 2020 | $5,185 | $305,088 | $140,174 | $164,914 |
| 2019 | $5,088 | $299,107 | $137,426 | $161,681 |
| 2018 | $4,991 | $293,243 | $134,732 | $158,511 |
| 2017 | $4,937 | $287,494 | $132,091 | $155,403 |
| 2016 | $4,653 | $281,857 | $129,501 | $152,356 |
| 2015 | $4,547 | $277,624 | $127,556 | $150,068 |
| 2014 | $4,430 | $272,187 | $125,058 | $147,129 |
Source: Public Records
Map
Nearby Homes
- 8801 Villa Campo Way
- 5302 Illinois Ave
- 0 Illinois Ave Unit 225121990
- 8514 Bordeaux Way
- 5137 Kenneth Ave
- 5540 Fetz Ln
- 8909 Ramstad Ave
- 5548 Fetz Ln
- 5596 Fetz Ln
- 5556 Fetz Ln
- 5536 Turnbull Cir
- 5564 Fetz Ln
- 8477 Rick Mary Ct
- 5112 Rabeneck Way
- 8940 Ramstad Ave
- 8625 Amber Oaks Ct
- 8771 Corinne Dr
- 8958 Sunset Ave
- 8486 Belcastel Way
- 8486 Wattle Way
- 5100 Illinois Ave
- 8705 El Chapul Way
- 5044 Illinois Ave
- 5106 Illinois Ave
- 5037 Illinois Ave
- 8706 El Chapul Way
- 5101 Illinois Ave
- 5112 Illinois Ave
- 8715 El Chapul Way
- 5116 Illinois Ave
- 5039 Havelok St
- 5033 Illinois Ave
- 5120 Illinois Ave
- 5031 Illinois Ave
- 5032 Illinois Ave
- 5119 Illinois Ave
- 8724 Blinman Way
- 5031 Havelok St
- 8719 El Chapul Way
- 8720 El Chapul Way