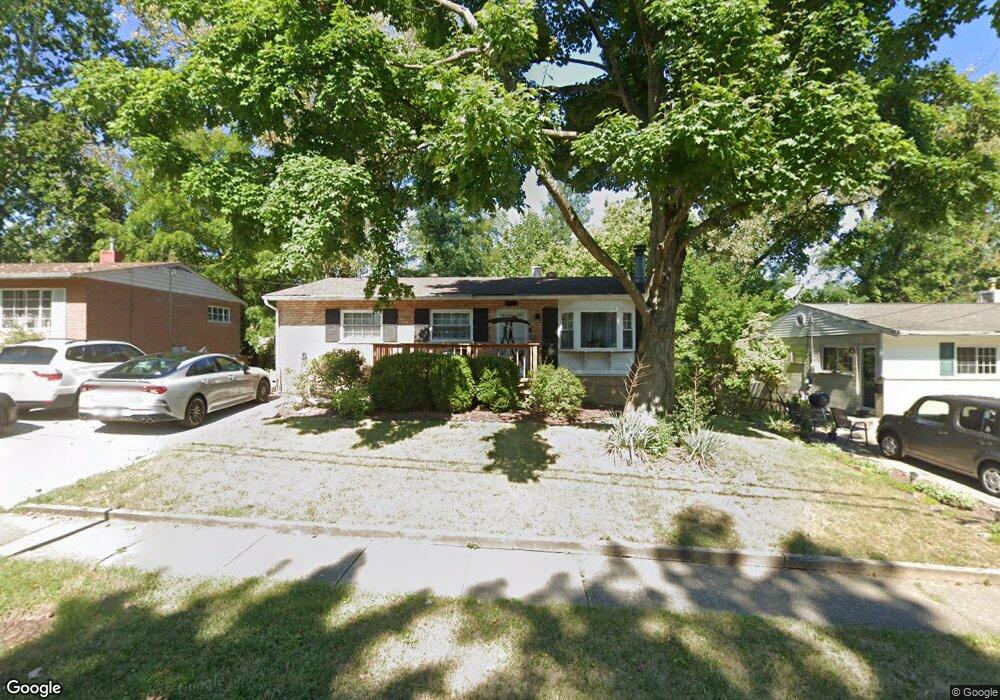
8705 Mockingbird Ln Cincinnati, OH 45231
Finneytown NeighborhoodEstimated Value: $206,190 - $244,000
3
Beds
2
Baths
1,120
Sq Ft
$196/Sq Ft
Est. Value
About This Home
This home is located at 8705 Mockingbird Ln, Cincinnati, OH 45231 and is currently estimated at $219,048, approximately $195 per square foot. 8705 Mockingbird Ln is a home located in Hamilton County with nearby schools including Finneytown Elementary School, Finneytown Secondary Campus, and St. Vivian School.
Ownership History
Date
Name
Owned For
Owner Type
Purchase Details
Closed on
Apr 23, 2008
Sold by
Kidd Kimberly J and Cooper Kimberly J
Bought by
Kidd Kimberly J
Current Estimated Value
Home Financials for this Owner
Home Financials are based on the most recent Mortgage that was taken out on this home.
Original Mortgage
$122,529
Outstanding Balance
$78,423
Interest Rate
6.17%
Mortgage Type
New Conventional
Estimated Equity
$140,625
Purchase Details
Closed on
Jul 19, 2001
Sold by
Apke Robert J Trs and Gail A
Bought by
Cooper Kimberly J
Home Financials for this Owner
Home Financials are based on the most recent Mortgage that was taken out on this home.
Original Mortgage
$94,300
Interest Rate
8.12%
Purchase Details
Closed on
Dec 5, 1995
Sold by
Apke Robert J and Apke Anna G
Bought by
Apke Robert J and Apke Anna G
Create a Home Valuation Report for This Property
The Home Valuation Report is an in-depth analysis detailing your home's value as well as a comparison with similar homes in the area
Home Values in the Area
Average Home Value in this Area
Purchase History
| Date | Buyer | Sale Price | Title Company |
|---|---|---|---|
| Kidd Kimberly J | -- | Attorney | |
| Cooper Kimberly J | $117,900 | -- | |
| Apke Robert J | -- | -- |
Source: Public Records
Mortgage History
| Date | Status | Borrower | Loan Amount |
|---|---|---|---|
| Open | Kidd Kimberly J | $122,529 | |
| Previous Owner | Cooper Kimberly J | $94,300 | |
| Closed | Cooper Kimberly J | $23,600 |
Source: Public Records
Tax History
| Year | Tax Paid | Tax Assessment Tax Assessment Total Assessment is a certain percentage of the fair market value that is determined by local assessors to be the total taxable value of land and additions on the property. | Land | Improvement |
|---|---|---|---|---|
| 2025 | $3,551 | $50,922 | $10,280 | $40,642 |
| 2024 | $3,469 | $50,922 | $10,280 | $40,642 |
| 2023 | $3,410 | $50,922 | $10,280 | $40,642 |
| 2022 | $3,207 | $34,738 | $10,143 | $24,595 |
| 2021 | $3,146 | $34,738 | $10,143 | $24,595 |
| 2020 | $3,197 | $34,738 | $10,143 | $24,595 |
| 2019 | $2,937 | $29,439 | $8,596 | $20,843 |
| 2018 | $2,711 | $29,439 | $8,596 | $20,843 |
| 2017 | $2,583 | $29,439 | $8,596 | $20,843 |
| 2016 | $2,476 | $27,735 | $8,880 | $18,855 |
| 2015 | $2,492 | $27,735 | $8,880 | $18,855 |
| 2014 | $2,494 | $27,735 | $8,880 | $18,855 |
| 2013 | $2,540 | $29,194 | $9,345 | $19,849 |
Source: Public Records
Map
Nearby Homes
- 1116 Madeleine Cir
- 8628 Mockingbird Ln
- 8829 Mockingbird Ln
- 8754 Monsanto Dr
- 1055 Hempstead Dr
- 1101 Meadowind Ct
- 1144 Hempstead Dr
- 8943 Monsanto Dr
- 958 Hollytree Dr
- 9137 Fontainebleau Terrace
- 1123 Compton Rd
- 1115 Compton Rd
- 1297 Landis Ln
- 8719 Hood Ct
- 1006 Hearthstone Dr
- 8771 Desoto Dr
- 881 Sabino Ct
- 7352 Clovernook Ave
- 8491 Daly Rd
- 816 Sabino Ct
- 8699 Mockingbird Ln
- 8713 Mockingbird Ln
- 8721 Mockingbird Ln
- 8710 Mockingbird Ln
- 8729 Mockingbird Ln
- 8687 Mockingbird Ln
- 8722 Mockingbird Ln
- 8692 Mockingbird Ln
- 8686 Elmtree Ave
- 8681 Mockingbird Ln
- 8737 Mockingbird Ln
- 8738 Mockingbird Ln
- 8687 Elmtree Ave
- 8678 Mockingbird Ln
- 1136 Madeleine Cir
- 8682 Elmtree Ave
- 1046 Jonquil Ln
- 1130 Madeleine Cir
- 1140 Madeleine Cir
- 8675 Mockingbird Ln
Your Personal Tour Guide
Ask me questions while you tour the home.