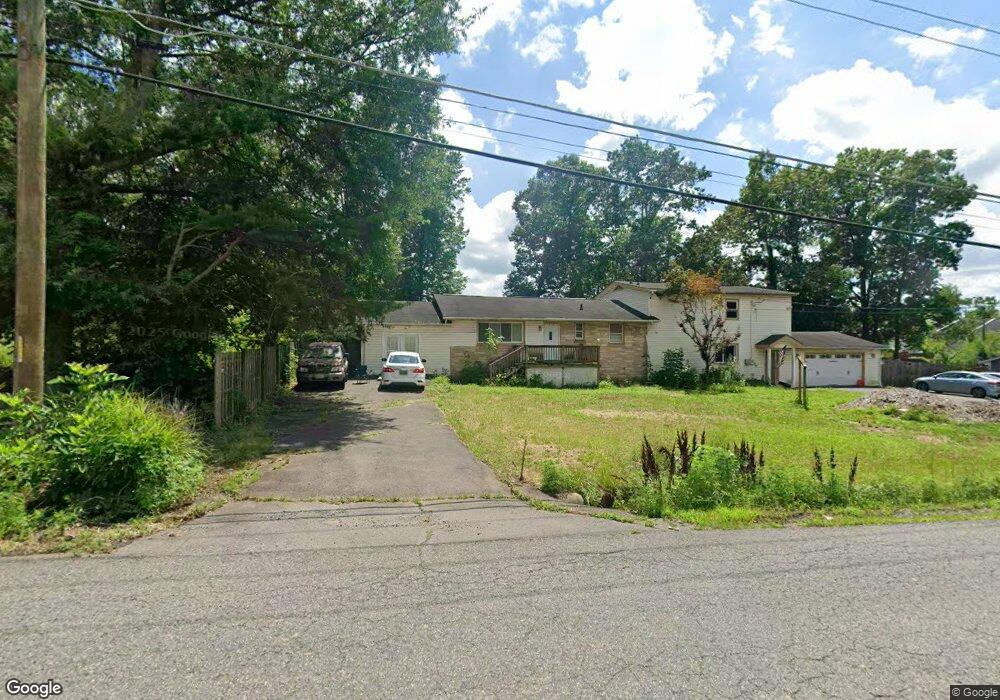
8705 Parkland St Manassas, VA 20111
Estimated Value: $539,000 - $604,000
6
Beds
4
Baths
2,568
Sq Ft
$221/Sq Ft
Est. Value
About This Home
This home is located at 8705 Parkland St, Manassas, VA 20111 and is currently estimated at $567,983, approximately $221 per square foot. 8705 Parkland St is a home located in Prince William County with nearby schools including Yorkshire Elementary School, Parkside Middle School, and Osbourn Park High School.
Ownership History
Date
Name
Owned For
Owner Type
Purchase Details
Closed on
Aug 12, 2009
Sold by
Deutsche Bank National Trust Company
Bought by
Seymour Ryan G
Current Estimated Value
Home Financials for this Owner
Home Financials are based on the most recent Mortgage that was taken out on this home.
Original Mortgage
$210,334
Interest Rate
5.14%
Mortgage Type
FHA
Purchase Details
Closed on
Feb 26, 2009
Sold by
Surety Trustees Llc Sub T
Bought by
Deutsche Bank Ntl Tr Co Tr and Indymac Indx Mtg Loan Trust,
Purchase Details
Closed on
May 31, 2000
Sold by
Crigger Contracting
Bought by
Cabezas Salvador A
Home Financials for this Owner
Home Financials are based on the most recent Mortgage that was taken out on this home.
Original Mortgage
$138,600
Interest Rate
8.12%
Purchase Details
Closed on
Feb 25, 2000
Sold by
Contimortgage Corp
Bought by
Kenney Eric R
Create a Home Valuation Report for This Property
The Home Valuation Report is an in-depth analysis detailing your home's value as well as a comparison with similar homes in the area
Home Values in the Area
Average Home Value in this Area
Purchase History
| Date | Buyer | Sale Price | Title Company |
|---|---|---|---|
| Seymour Ryan G | $185,000 | First Am Title Ins Co | |
| Deutsche Bank Ntl Tr Co Tr | $203,388 | -- | |
| Cabezas Salvador A | $122,000 | -- | |
| Kenney Eric R | $72,000 | -- |
Source: Public Records
Mortgage History
| Date | Status | Borrower | Loan Amount |
|---|---|---|---|
| Previous Owner | Seymour Ryan G | $210,334 | |
| Previous Owner | Cabezas Salvador A | $138,600 |
Source: Public Records
Tax History Compared to Growth
Tax History
| Year | Tax Paid | Tax Assessment Tax Assessment Total Assessment is a certain percentage of the fair market value that is determined by local assessors to be the total taxable value of land and additions on the property. | Land | Improvement |
|---|---|---|---|---|
| 2025 | $4,560 | $474,600 | $140,500 | $334,100 |
| 2024 | $4,560 | $458,500 | $129,300 | $329,200 |
| 2023 | $4,422 | $425,000 | $119,500 | $305,500 |
| 2022 | $4,663 | $410,700 | $109,500 | $301,200 |
| 2021 | $4,568 | $372,300 | $96,400 | $275,900 |
| 2020 | $5,188 | $334,700 | $96,400 | $238,300 |
| 2019 | $5,140 | $331,600 | $96,400 | $235,200 |
| 2018 | $4,165 | $344,900 | $96,400 | $248,500 |
| 2017 | $3,885 | $312,900 | $83,000 | $229,900 |
| 2016 | $3,390 | $274,500 | $83,000 | $191,500 |
| 2015 | $2,833 | $256,600 | $77,000 | $179,600 |
| 2014 | $2,833 | $223,100 | $68,000 | $155,100 |
Source: Public Records
Map
Nearby Homes
- 7505 Bosbury Ct
- 7613 Glenolden Place
- 7636 Shelley Ln
- 7407 Peppertree Ln
- 7601 Bull Run Rd
- 122 Holden Dr
- 8401 Yorkshire Ln
- 107 Luxor St
- 8514 Charnwood Ct
- 8501 Charnwood Ct
- 8602 Spruce St
- 186 Lambert Dr
- 8118 Rugby Rd
- 8117 Leland Rd
- 7465 Riding Meadow Way Unit 42
- 8006 Well St
- 7444 Riding Meadow Way
- 7362 Riding Meadow Way
- 7394 Riding Meadow Way
- 7723 Appomattox Ave
- 8722 Stoneridge Dr
- 8703 Parkland St
- 8707 Parkland St
- 8704 Parkland St
- 8706 Parkland St
- 8702 Parkland St
- 8699 Parkland St
- 7501 Bosbury Ct
- 7601 Shelley Ln
- 7503 Bosbury Ct
- 7603 Shelley Ln
- 7509 Bosbury Ct
- 7600 Stuart Ct
- 7602 Stuart Ct
- 7511 Bosbury Ct
- 7604 Stuart Ct
- 7605 Shelley Ln
- 7606 Stuart Ct
- 8709 Parkland St
- 7608 Stuart Ct