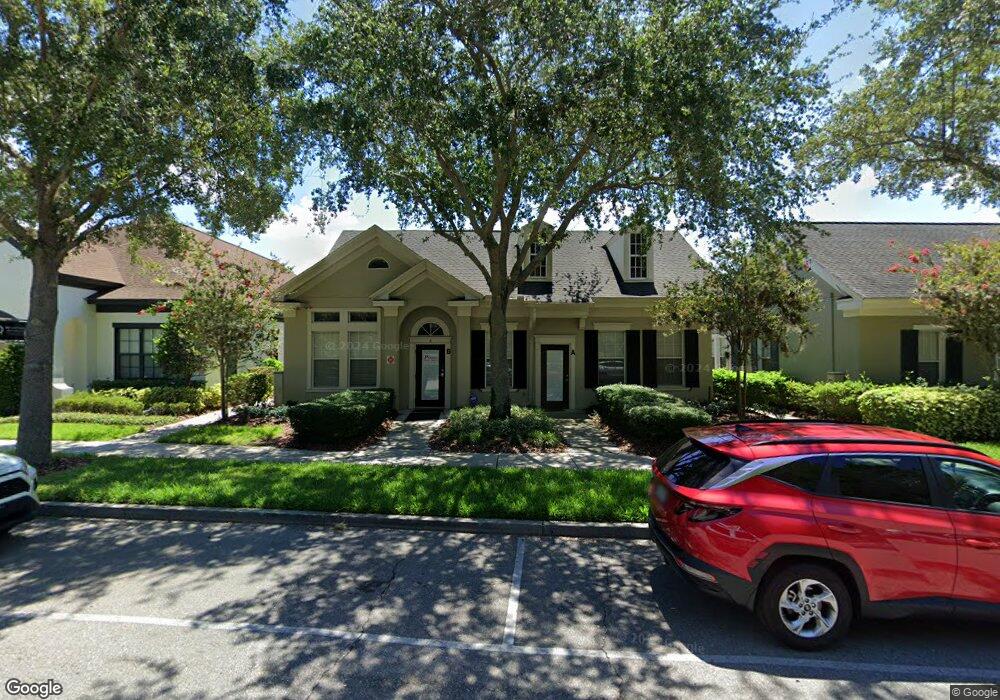
871 Outer Rd Unit B & D Orlando, FL 32814
Baldwin Park NeighborhoodEstimated Value: $765,517
Studio
--
Bath
2,933
Sq Ft
$261/Sq Ft
Est. Value
About This Home
This home is located at 871 Outer Rd Unit B & D, Orlando, FL 32814 and is currently estimated at $765,517, approximately $261 per square foot. 871 Outer Rd Unit B & D is a home located in Orange County with nearby schools including Baldwin Park Elementary, Glenridge Middle, and Winter Park High.
Ownership History
Date
Name
Owned For
Owner Type
Purchase Details
Closed on
Jan 1, 2021
Sold by
Jones Skiles K
Bought by
Castle Knight Llc
Current Estimated Value
Home Financials for this Owner
Home Financials are based on the most recent Mortgage that was taken out on this home.
Original Mortgage
$432,000
Interest Rate
2.8%
Mortgage Type
Commercial
Purchase Details
Closed on
Dec 11, 2020
Sold by
Atec Real Estate Llc
Bought by
Jones Skiles K and Jones Dianna Best
Home Financials for this Owner
Home Financials are based on the most recent Mortgage that was taken out on this home.
Original Mortgage
$432,000
Interest Rate
2.8%
Mortgage Type
Commercial
Purchase Details
Closed on
Jul 29, 2005
Sold by
Harkins Development Corp
Bought by
Atec Real Estate Llc
Home Financials for this Owner
Home Financials are based on the most recent Mortgage that was taken out on this home.
Original Mortgage
$259,625
Interest Rate
5.59%
Mortgage Type
Commercial
Create a Home Valuation Report for This Property
The Home Valuation Report is an in-depth analysis detailing your home's value as well as a comparison with similar homes in the area
Home Values in the Area
Average Home Value in this Area
Purchase History
| Date | Buyer | Sale Price | Title Company |
|---|---|---|---|
| Castle Knight Llc | $100 | -- | |
| Castle Knight Llc | -- | Patriot Legal Group | |
| Jones Skiles K | $540,000 | Attorney | |
| Atec Real Estate Llc | $324,000 | -- |
Source: Public Records
Mortgage History
| Date | Status | Borrower | Loan Amount |
|---|---|---|---|
| Previous Owner | Jones Skiles K | $432,000 | |
| Previous Owner | Atec Real Estate Llc | $259,625 |
Source: Public Records
Tax History
| Year | Tax Paid | Tax Assessment Tax Assessment Total Assessment is a certain percentage of the fair market value that is determined by local assessors to be the total taxable value of land and additions on the property. | Land | Improvement |
|---|---|---|---|---|
| 2025 | $8,164 | $382,330 | -- | $382,330 |
| 2024 | $7,322 | $364,770 | -- | $364,770 |
| 2023 | $7,322 | $371,525 | $74,305 | $297,220 |
| 2022 | $6,516 | $297,220 | $59,444 | $237,776 |
| 2021 | $6,214 | $276,955 | $55,391 | $221,564 |
| 2020 | $5,516 | $276,955 | $55,391 | $221,564 |
| 2019 | $5,425 | $256,690 | $51,338 | $205,352 |
| 2018 | $5,152 | $243,180 | $48,636 | $194,544 |
| 2017 | $4,552 | $175,630 | $35,126 | $140,504 |
| 2016 | $4,562 | $172,903 | $100 | $172,803 |
| 2015 | $4,639 | $173,119 | $100 | $173,019 |
| 2014 | $4,458 | $161,902 | $33,775 | $128,127 |
Source: Public Records
Map
Nearby Homes
- 901 Lake Baldwin Ln
- 4313 Roush Ave
- 4317 Roush Ave
- 4329 Roush Ave
- 4333 Roush Ave
- 4485 Trapp Ln
- 995 Juel St
- 4330 Rixey St
- 4201 Park Lake St
- 1009 Jamajo Blvd
- 4474 Twinview Ln
- 4416 Twinview Ln
- 1007 Bennett Rd
- 1148 Lake Baldwin Ln
- 4038 Ibis Dr
- 812 High St
- 4575 New Broad St
- 1926 Risby Aly Unit 16
- 861 High St
- 4715 Beach Blvd
- 871 Outer Rd Unit B
- 871 Outer Rd Unit C
- 871 Outer Rd Unit A, B, & D
- 871 Outer Rd Unit 7
- 4606 Halder Ln Unit 7
- 855 Outer Rd
- 4625 Halder Ln
- 891 Outer Rd Unit B
- 851 Outer Rd
- 899 Outer Rd Unit 7
- 1014 Maltby Ave
- 903 Outer Rd
- 4491 Fox St
- 4501 Fox St
- 4473 Fox St
- 4455 Fox St Unit 1
- 4523 Fox St
- 942 Lake Baldwin Ln
- 4437 Fox St Unit 1
- 1008 Maltby Ave
Your Personal Tour Guide
Ask me questions while you tour the home.