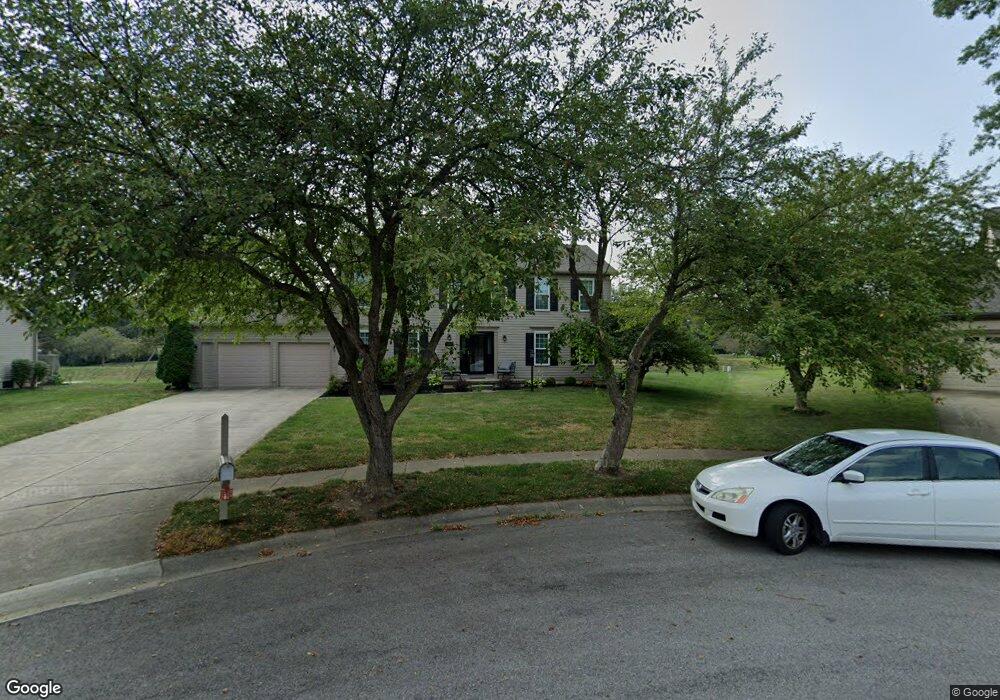
873 Selkirk Way Pickerington, OH 43147
Estimated Value: $435,000 - $474,000
5
Beds
3
Baths
2,482
Sq Ft
$181/Sq Ft
Est. Value
About This Home
This home is located at 873 Selkirk Way, Pickerington, OH 43147 and is currently estimated at $449,027, approximately $180 per square foot. 873 Selkirk Way is a home located in Fairfield County with nearby schools including Violet Elementary School, Pickerington Lakeview Junior High School, and Toll Gate Middle School.
Ownership History
Date
Name
Owned For
Owner Type
Purchase Details
Closed on
Mar 21, 2022
Sold by
Mangan Timothy J and Mangan Kathleen F
Bought by
Delong Steven R and Delong Laura K
Current Estimated Value
Home Financials for this Owner
Home Financials are based on the most recent Mortgage that was taken out on this home.
Original Mortgage
$288,750
Outstanding Balance
$269,786
Interest Rate
3.92%
Mortgage Type
New Conventional
Estimated Equity
$179,241
Purchase Details
Closed on
Mar 3, 1992
Bought by
Mangan Timothy J
Purchase Details
Closed on
Oct 25, 1991
Bought by
The Ryland Group
Create a Home Valuation Report for This Property
The Home Valuation Report is an in-depth analysis detailing your home's value as well as a comparison with similar homes in the area
Home Values in the Area
Average Home Value in this Area
Purchase History
| Date | Buyer | Sale Price | Title Company |
|---|---|---|---|
| Delong Steven R | -- | Stewart Title | |
| Mangan Timothy J | $134,600 | -- | |
| The Ryland Group | $24,000 | -- |
Source: Public Records
Mortgage History
| Date | Status | Borrower | Loan Amount |
|---|---|---|---|
| Open | Delong Steven R | $288,750 |
Source: Public Records
Tax History Compared to Growth
Tax History
| Year | Tax Paid | Tax Assessment Tax Assessment Total Assessment is a certain percentage of the fair market value that is determined by local assessors to be the total taxable value of land and additions on the property. | Land | Improvement |
|---|---|---|---|---|
| 2024 | $12,216 | $99,240 | $16,860 | $82,380 |
| 2023 | $4,679 | $99,240 | $16,860 | $82,380 |
| 2022 | $4,694 | $99,240 | $16,860 | $82,380 |
| 2021 | $4,308 | $77,560 | $15,330 | $62,230 |
| 2020 | $4,328 | $77,560 | $15,330 | $62,230 |
| 2019 | $4,382 | $77,560 | $15,330 | $62,230 |
| 2018 | $2,338 | $64,870 | $15,330 | $49,540 |
| 2017 | $4,230 | $65,160 | $15,450 | $49,710 |
| 2016 | $4,208 | $65,160 | $15,450 | $49,710 |
| 2015 | $3,993 | $58,460 | $12,880 | $45,580 |
| 2014 | $3,945 | $58,460 | $12,880 | $45,580 |
| 2013 | $3,945 | $58,460 | $12,880 | $45,580 |
Source: Public Records
Map
Nearby Homes
- 756 Stewart Ct
- 964 Dunmore Ct
- 1035 Milford Dr
- 812 Melrose Blvd
- 11608 Meadow Ave
- 12008 Sheldrake Ct
- 1058 Milford Dr
- 825 Brookside Dr
- 12316 Thoroughbred Dr
- 891 Dunvegan Cir
- 8950 Easton Dr
- 12335 Thoroughbred Dr
- 9581 Brookside Dr
- 692 Hill Rd N
- 12052 Peppermill Ln
- 12394 Bentwood Farms Dr
- 500 Courtright Dr
- 612 Ludham Trail
- 1324 Brookview Cir
- 650 Cherry Hill Dr