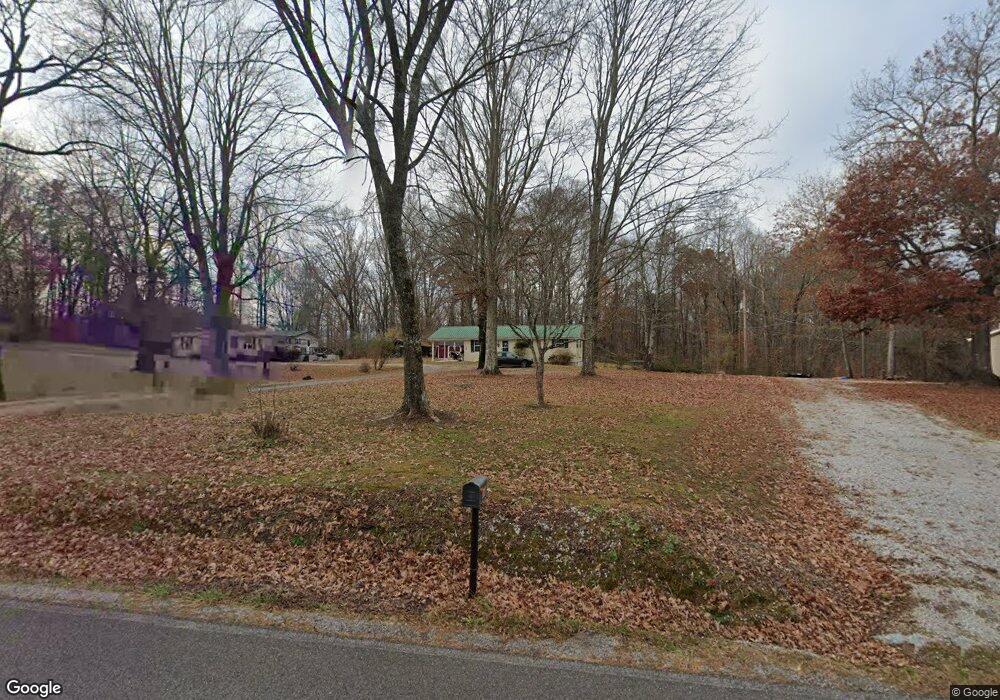
874 Pinecrest Rd Jacksboro, TN 37757
Estimated Value: $177,000 - $274,000
--
Bed
1
Bath
912
Sq Ft
$239/Sq Ft
Est. Value
About This Home
This home is located at 874 Pinecrest Rd, Jacksboro, TN 37757 and is currently estimated at $218,253, approximately $239 per square foot. 874 Pinecrest Rd is a home located in Campbell County.
Ownership History
Date
Name
Owned For
Owner Type
Purchase Details
Closed on
Nov 16, 2018
Sold by
Mott Chris and Mott Brandi
Bought by
Mott Dora Grace
Current Estimated Value
Home Financials for this Owner
Home Financials are based on the most recent Mortgage that was taken out on this home.
Original Mortgage
$130,119
Interest Rate
4.8%
Mortgage Type
New Conventional
Purchase Details
Closed on
Mar 5, 2018
Sold by
Mott Brandie and Wilson Eric
Bought by
Mott Chris and Mott Brandie
Purchase Details
Closed on
Feb 20, 2018
Sold by
Wilson and James
Bought by
Wilson Eric
Purchase Details
Closed on
Oct 19, 2015
Sold by
Wilson Bobby Ray
Bought by
Mott Brandie and Wilson Eric
Purchase Details
Closed on
Sep 24, 2015
Sold by
Wood John Estate
Bought by
Wilson Bobby Ray
Purchase Details
Closed on
Aug 29, 2005
Sold by
Wilson Ruby
Bought by
Wood John and Wood Louise
Purchase Details
Closed on
Aug 29, 1995
Bought by
Wood John Louise
Purchase Details
Closed on
Jul 24, 1962
Bought by
Wood John and Betty Louise
Create a Home Valuation Report for This Property
The Home Valuation Report is an in-depth analysis detailing your home's value as well as a comparison with similar homes in the area
Home Values in the Area
Average Home Value in this Area
Purchase History
| Date | Buyer | Sale Price | Title Company |
|---|---|---|---|
| Mott Dora Grace | -- | Certified Title Company | |
| Mott Chris | -- | None Available | |
| Wilson Eric | -- | Claiborne Ashley L | |
| Mott Brandie | -- | -- | |
| Wilson Bobby Ray | -- | -- | |
| Wood John | $10,000 | -- | |
| Wood John Louise | $10,000 | -- | |
| Wood John | -- | -- |
Source: Public Records
Mortgage History
| Date | Status | Borrower | Loan Amount |
|---|---|---|---|
| Previous Owner | Mott Dora Grace | $130,119 |
Source: Public Records
Tax History Compared to Growth
Tax History
| Year | Tax Paid | Tax Assessment Tax Assessment Total Assessment is a certain percentage of the fair market value that is determined by local assessors to be the total taxable value of land and additions on the property. | Land | Improvement |
|---|---|---|---|---|
| 2024 | $601 | $49,450 | $16,900 | $32,550 |
| 2023 | $481 | $23,300 | $11,050 | $12,250 |
| 2022 | $481 | $23,300 | $11,050 | $12,250 |
| 2021 | $481 | $23,300 | $11,050 | $12,250 |
| 2020 | $471 | $23,300 | $11,050 | $12,250 |
| 2019 | $941 | $23,300 | $11,050 | $12,250 |
| 2018 | $506 | $22,500 | $11,400 | $11,100 |
| 2017 | $506 | $22,500 | $11,400 | $11,100 |
| 2016 | $506 | $22,500 | $11,400 | $11,100 |
| 2015 | $448 | $22,500 | $11,400 | $11,100 |
| 2014 | $448 | $22,500 | $11,400 | $11,100 |
| 2013 | -- | $22,500 | $11,400 | $11,100 |
Source: Public Records
Map
Nearby Homes
- 241 Cumberland View Dr
- 0 McGhee Ln Unit 1316190
- 110 Cumberland Overlook Ln
- 1327 Pinecrest Rd
- 1658 Pinecrest Rd
- 107 Bertha Ln
- 452 Clover Cir
- 1517 Towe String Rd
- 264 Cypress Ln
- 1566 Lakewood Rd
- 0 Storm Ln Unit 1307847
- 115 Queener St
- 204 Queener St
- 359 McDeerman Rd
- 211 Timberlake Cir
- 0 Pinecrest Rd
- 0 Indian River Boat Dock Rd
- 205 Hickory Ln
- 221 Kay Springs Cir
- 0 Dogwood Ln
- 869 Pinecrest Rd
- 849 Pinecrest Rd
- 905 Pinecrest Rd
- 918 Pinecrest Rd
- 925 Pinecrest Rd
- 809 Pinecrest Rd
- 952 Pinecrest Rd
- 957 Pinecrest Rd
- 769 Pinecrest Rd
- 972 Pinecrest Rd
- 105 Cumberland View Dr
- 169 Big Oak Ln
- 738 Pinecrest Rd
- 0 Vinsant Estates Rd Unit 613594
- 0 Vinsant Estates Rd Unit 816716
- 0 Vinsant Estates Rd Unit 937890
- 0 Vinsant Estates Rd Unit 1017247
- 994 Pinecrest Rd
- 0 113 Firehouse Ln Unit 925469
- 900 River Rd