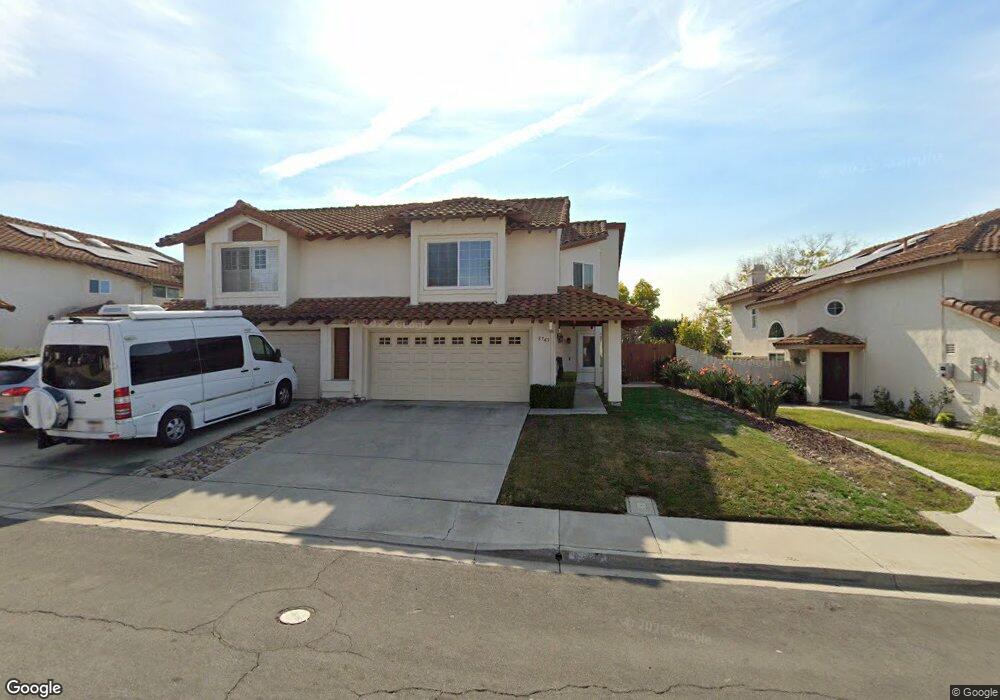
8743 Ginger Snap Ln San Diego, CA 92129
Rancho Peñasquitos NeighborhoodEstimated Value: $1,065,000 - $1,191,000
3
Beds
3
Baths
1,585
Sq Ft
$713/Sq Ft
Est. Value
About This Home
This home is located at 8743 Ginger Snap Ln, San Diego, CA 92129 and is currently estimated at $1,130,891, approximately $713 per square foot. 8743 Ginger Snap Ln is a home located in San Diego County with nearby schools including Park Village Elementary School, Mesa Verde Middle School, and Westview High School.
Ownership History
Date
Name
Owned For
Owner Type
Purchase Details
Closed on
Oct 4, 2023
Sold by
Fox Elena M
Bought by
Elena M Fox Living Trust and Fox
Current Estimated Value
Purchase Details
Closed on
Oct 25, 2018
Sold by
Fox Elena M
Bought by
Fox Elena M and Elena M Fox Living Trust
Purchase Details
Closed on
Nov 14, 2016
Sold by
Fox Terrence
Bought by
Fox Elena M
Purchase Details
Closed on
Nov 8, 2011
Sold by
U S Bank National Association
Bought by
Fox Elena M
Home Financials for this Owner
Home Financials are based on the most recent Mortgage that was taken out on this home.
Original Mortgage
$346,430
Interest Rate
4.4%
Mortgage Type
FHA
Purchase Details
Closed on
Mar 16, 2011
Sold by
Guner Jale
Bought by
U S Bank National Association
Purchase Details
Closed on
Oct 21, 2004
Sold by
Castaneda Jason and Guner Jale
Bought by
Guner Jale
Home Financials for this Owner
Home Financials are based on the most recent Mortgage that was taken out on this home.
Original Mortgage
$416,000
Interest Rate
5%
Mortgage Type
Purchase Money Mortgage
Purchase Details
Closed on
Feb 19, 2004
Sold by
Guner Jale
Bought by
Castaneda Jason and Guner Jale
Purchase Details
Closed on
Jan 6, 2004
Sold by
Castaneda Jason
Bought by
Guner Jale
Home Financials for this Owner
Home Financials are based on the most recent Mortgage that was taken out on this home.
Original Mortgage
$351,200
Interest Rate
5.12%
Mortgage Type
Purchase Money Mortgage
Purchase Details
Closed on
Dec 12, 2003
Sold by
Oxidine Catherine A and Oxidine William D
Bought by
Guner Jale
Home Financials for this Owner
Home Financials are based on the most recent Mortgage that was taken out on this home.
Original Mortgage
$351,200
Interest Rate
5.12%
Mortgage Type
Purchase Money Mortgage
Purchase Details
Closed on
Sep 8, 2002
Sold by
Collins Timothy M and Collins Christine A
Bought by
Oxidine William D and Oxidine Catherine A
Home Financials for this Owner
Home Financials are based on the most recent Mortgage that was taken out on this home.
Original Mortgage
$294,400
Interest Rate
6.87%
Purchase Details
Closed on
Oct 6, 1998
Sold by
Hasson Gregory M and Nakagawa Lynn M
Bought by
Comer Christine A
Home Financials for this Owner
Home Financials are based on the most recent Mortgage that was taken out on this home.
Original Mortgage
$156,720
Interest Rate
6.54%
Purchase Details
Closed on
Sep 15, 1989
Purchase Details
Closed on
Mar 31, 1987
Purchase Details
Closed on
Mar 26, 1986
Create a Home Valuation Report for This Property
The Home Valuation Report is an in-depth analysis detailing your home's value as well as a comparison with similar homes in the area
Home Values in the Area
Average Home Value in this Area
Purchase History
| Date | Buyer | Sale Price | Title Company |
|---|---|---|---|
| Elena M Fox Living Trust | -- | None Listed On Document | |
| Fox Elena M | -- | None Available | |
| Fox Elena M | -- | None Available | |
| Fox Elena M | $360,000 | First American Title Ins Co | |
| U S Bank National Association | $465,187 | None Available | |
| Guner Jale | -- | Stewart Title Of California | |
| Castaneda Jason | -- | -- | |
| Guner Jale | -- | Chicago Title Co | |
| Guner Jale | $439,000 | Chicago Title Co | |
| Oxidine William D | $368,000 | Chicago Title Co | |
| Comer Christine A | $196,000 | Southland Title | |
| -- | $185,000 | -- | |
| -- | $138,500 | -- | |
| -- | $113,500 | -- |
Source: Public Records
Mortgage History
| Date | Status | Borrower | Loan Amount |
|---|---|---|---|
| Previous Owner | Fox Elena M | $346,430 | |
| Previous Owner | Guner Jale | $416,000 | |
| Previous Owner | Guner Jale | $351,200 | |
| Previous Owner | Oxidine William D | $294,400 | |
| Previous Owner | Comer Christine A | $156,720 | |
| Closed | Oxidine William D | $73,600 | |
| Closed | Guner Jale | $87,800 | |
| Closed | Guner Jale | $52,000 |
Source: Public Records
Tax History Compared to Growth
Tax History
| Year | Tax Paid | Tax Assessment Tax Assessment Total Assessment is a certain percentage of the fair market value that is determined by local assessors to be the total taxable value of land and additions on the property. | Land | Improvement |
|---|---|---|---|---|
| 2025 | $5,105 | $465,653 | $251,206 | $214,447 |
| 2024 | $5,105 | $456,524 | $246,281 | $210,243 |
| 2023 | $4,993 | $447,573 | $241,452 | $206,121 |
| 2022 | $4,901 | $438,798 | $236,718 | $202,080 |
| 2021 | $4,834 | $430,195 | $232,077 | $198,118 |
| 2020 | $4,771 | $425,785 | $229,698 | $196,087 |
| 2019 | $4,657 | $417,438 | $225,195 | $192,243 |
| 2018 | $4,543 | $409,254 | $220,780 | $188,474 |
| 2017 | $4,407 | $401,230 | $216,451 | $184,779 |
| 2016 | $4,307 | $393,363 | $212,207 | $181,156 |
| 2015 | $4,230 | $387,455 | $209,020 | $178,435 |
| 2014 | $4,012 | $368,866 | $204,926 | $163,940 |
Source: Public Records
Map
Nearby Homes
- 12573 Brickellia St
- 12537 Ginger Snap Ct
- 8695 Rideabout Ln
- 8672 Creekwood Ln
- 12518 Darkwood Rd
- 8754 Park Run Rd
- 9012 Buckwheat St
- 12465 Pathos Ln
- 12776 Isocoma St Unit 4
- 9068 Buckwheat St
- 12880 War Horse St
- 12485 Picrus St
- 12740 Prairie Dog Ave
- 13146 Thunderhead St
- 9342 Twin Trails Dr Unit 303
- 9302 Twin Trails Dr Unit 204
- 9446 Pipilo St
- 12660 Stella Ln
- 9525 Vervain St
- 11598 Alkaid Dr
- 8737 Ginger Snap Ln Unit 1
- 8749 Ginger Snap Ln
- 8731 Ginger Snap Ln
- 8755 Ginger Snap Ln
- 8725 Ginger Snap Ln
- 8761 Ginger Snap Ln Unit 1
- 8719 Ginger Snap Ln
- 8720 Ginger Snap Ln
- 8730 Ginger Snap Ln Unit 1
- 8767 Ginger Snap Ln
- 8740 Ginger Snap Ln
- 8773 Ginger Snap Ln
- 8750 Ginger Snap Ln
- 8760 Ginger Snap Ln
- 8713 Ginger Snap Ln
- 8707 Ginger Snap Ln
- 8779 Ginger Snap Ln
- 8768 Ginger Snap Ln
- 8776 Ginger Snap Ln Unit 1
- 8785 Ginger Snap Ln