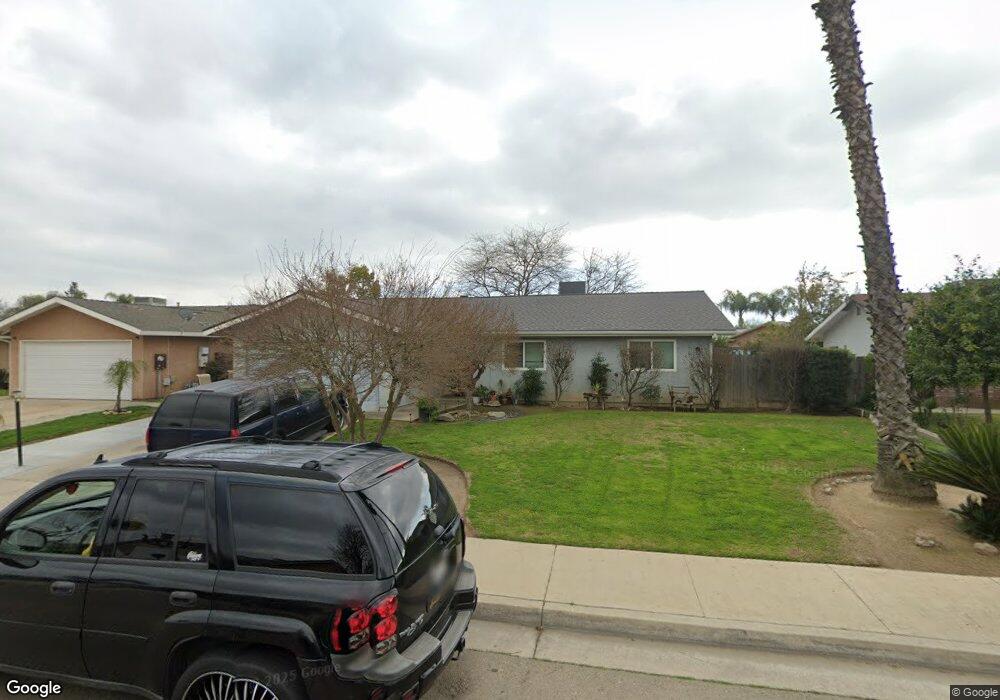
875 3rd St Sanger, CA 93657
Estimated Value: $356,396 - $373,000
4
Beds
2
Baths
1,500
Sq Ft
$244/Sq Ft
Est. Value
About This Home
This home is located at 875 3rd St, Sanger, CA 93657 and is currently estimated at $365,799, approximately $243 per square foot. 875 3rd St is a home located in Fresno County with nearby schools including Wilson Elementary School, Washington Academic Middle School, and Sanger High School.
Ownership History
Date
Name
Owned For
Owner Type
Purchase Details
Closed on
Oct 2, 2003
Sold by
Housing Authority Of Fresno County
Bought by
Lopez Elva D
Current Estimated Value
Home Financials for this Owner
Home Financials are based on the most recent Mortgage that was taken out on this home.
Original Mortgage
$73,325
Interest Rate
5.62%
Mortgage Type
Purchase Money Mortgage
Purchase Details
Closed on
Feb 1, 1995
Sold by
Perez Roberto N and Perez Mary Helen
Bought by
Housing Authority Of Fresno
Create a Home Valuation Report for This Property
The Home Valuation Report is an in-depth analysis detailing your home's value as well as a comparison with similar homes in the area
Home Values in the Area
Average Home Value in this Area
Purchase History
| Date | Buyer | Sale Price | Title Company |
|---|---|---|---|
| Lopez Elva D | $93,000 | Stewart Title Of Fresno Cnty | |
| Housing Authority Of Fresno | -- | Central Title Company |
Source: Public Records
Mortgage History
| Date | Status | Borrower | Loan Amount |
|---|---|---|---|
| Previous Owner | Lopez Elva D | $73,325 | |
| Closed | Lopez Elva D | $15,000 |
Source: Public Records
Tax History
| Year | Tax Paid | Tax Assessment Tax Assessment Total Assessment is a certain percentage of the fair market value that is determined by local assessors to be the total taxable value of land and additions on the property. | Land | Improvement |
|---|---|---|---|---|
| 2025 | $2,355 | $191,924 | $49,752 | $142,172 |
| 2023 | $2,203 | $184,473 | $47,821 | $136,652 |
| 2022 | $2,168 | $180,857 | $46,884 | $133,973 |
| 2021 | $2,149 | $177,312 | $45,965 | $131,347 |
| 2020 | $2,085 | $175,495 | $45,494 | $130,001 |
| 2019 | $2,042 | $172,054 | $44,602 | $127,452 |
| 2018 | $1,955 | $168,681 | $43,728 | $124,953 |
| 2017 | $1,921 | $165,374 | $42,871 | $122,503 |
| 2016 | $1,804 | $162,132 | $42,031 | $120,101 |
| 2015 | $1,451 | $128,400 | $33,200 | $95,200 |
| 2014 | $1,364 | $120,300 | $31,100 | $89,200 |
Source: Public Records
Map
Nearby Homes
Your Personal Tour Guide
Ask me questions while you tour the home.