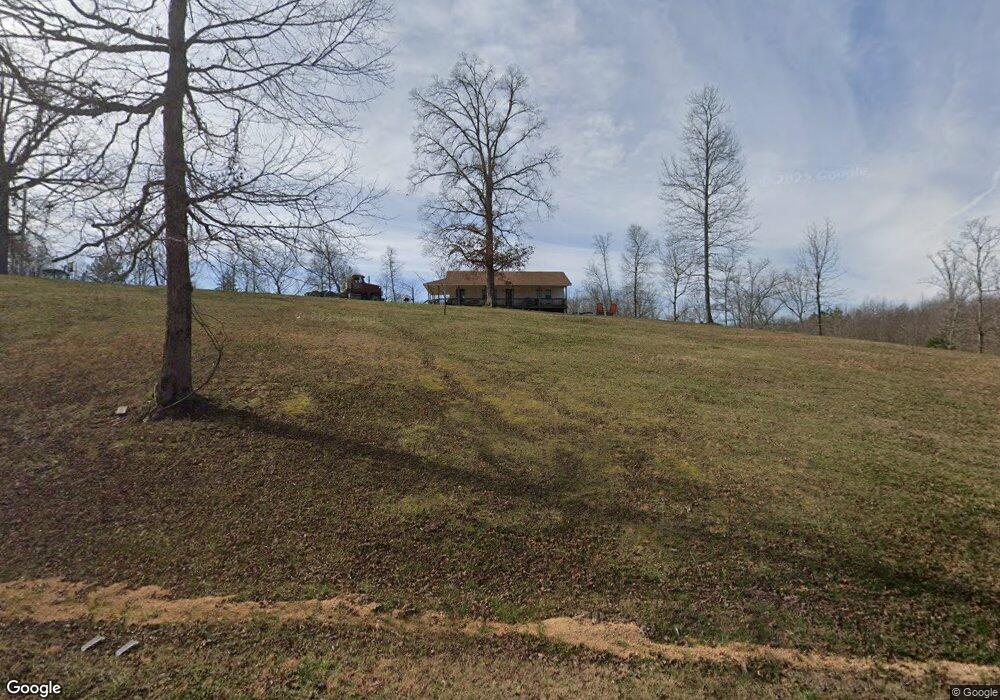
875 Bull Hollow Loop Savannah, TN 38372
Estimated Value: $160,000 - $192,000
--
Bed
2
Baths
864
Sq Ft
$197/Sq Ft
Est. Value
About This Home
This home is located at 875 Bull Hollow Loop, Savannah, TN 38372 and is currently estimated at $170,314, approximately $197 per square foot. 875 Bull Hollow Loop is a home located in Hardin County with nearby schools including Hardin County High School.
Ownership History
Date
Name
Owned For
Owner Type
Purchase Details
Closed on
Sep 1, 2023
Sold by
Benson Carla Diane
Bought by
Benson Cleatus Harold
Current Estimated Value
Purchase Details
Closed on
Jul 10, 2013
Sold by
Hill Kevin
Bought by
Benson Cleatus and Benson Carla Diane
Home Financials for this Owner
Home Financials are based on the most recent Mortgage that was taken out on this home.
Original Mortgage
$56,074
Interest Rate
4%
Mortgage Type
Commercial
Purchase Details
Closed on
May 5, 2006
Sold by
Cleatus Benson
Bought by
Kevin Hill
Home Financials for this Owner
Home Financials are based on the most recent Mortgage that was taken out on this home.
Original Mortgage
$50,000
Interest Rate
6.39%
Purchase Details
Closed on
Jan 17, 1995
Sold by
Edward Miller
Bought by
Cleatus Benson
Purchase Details
Closed on
Oct 7, 1987
Bought by
Miller Edward and Miller Regina
Purchase Details
Closed on
Jul 27, 1974
Bought by
Robertson Berry L and Robertson Wanda
Create a Home Valuation Report for This Property
The Home Valuation Report is an in-depth analysis detailing your home's value as well as a comparison with similar homes in the area
Home Values in the Area
Average Home Value in this Area
Purchase History
| Date | Buyer | Sale Price | Title Company |
|---|---|---|---|
| Benson Cleatus Harold | -- | None Listed On Document | |
| Benson Cleatus | $65,000 | -- | |
| Kevin Hill | $65,000 | -- | |
| Cleatus Benson | $42,000 | -- | |
| Miller Edward | $31,600 | -- | |
| Robertson Berry L | -- | -- |
Source: Public Records
Mortgage History
| Date | Status | Borrower | Loan Amount |
|---|---|---|---|
| Previous Owner | Benson Cleatus | $56,074 | |
| Previous Owner | Robertson Berry L | $50,000 |
Source: Public Records
Tax History Compared to Growth
Tax History
| Year | Tax Paid | Tax Assessment Tax Assessment Total Assessment is a certain percentage of the fair market value that is determined by local assessors to be the total taxable value of land and additions on the property. | Land | Improvement |
|---|---|---|---|---|
| 2024 | $648 | $37,025 | $3,675 | $33,350 |
| 2023 | $648 | $37,025 | $3,675 | $33,350 |
| 2022 | $401 | $19,475 | $3,025 | $16,450 |
| 2021 | $298 | $19,475 | $3,025 | $16,450 |
| 2020 | $298 | $14,475 | $3,025 | $11,450 |
| 2019 | $298 | $14,475 | $3,025 | $11,450 |
| 2018 | $288 | $14,475 | $3,025 | $11,450 |
| 2017 | $299 | $14,375 | $2,700 | $11,675 |
| 2016 | $299 | $14,375 | $2,700 | $11,675 |
| 2015 | $262 | $14,375 | $2,700 | $11,675 |
| 2014 | $262 | $14,375 | $2,700 | $11,675 |
Source: Public Records
Map
Nearby Homes
- 0 Morris Rd
- TRACT 6 Cherry Chapel Loop
- TRACT 5 Cherry Chapel Loop
- TRACT 4 Cherry Chapel Loop
- TRACT 3 Cherry Chapel Loop
- TRACT 2 Cherry Chapel Loop
- TRACT 1 Cherry Chapel Loop
- 285 Deans Ln
- 3117 2nd Creek Rd
- 0 69 Hwy Unit 10201709
- 0 Highway 69 Hwy Unit 10192438
- 2245 Big Ivy Rd
- 0 Fox Ln
- 600 County Road 146
- 0000 County Road 126
- 000 County Road 126
- 00 County Road 126
- 0 County Road 126
- Tract 8 County Road 126
- Tract 7 County Road 126
- 875 Bull Hollow Loop
- 645 Bull Hollow Loop
- 820 Bull Hollow Loop
- 660 Bull Hollow Loop
- 480 Bull Hollow Loop
- 430 Bull Hollow Loop
- 275 Bull Hollow Loop
- 235 Bull Hollow Loop
- 235 Bull Hollow Loop
- 2190 Morris Rd
- 2080 Morris Rd
- 2320 Morris Rd
- 2030 Morris Rd
- 2430 Morris Rd
- 2345 Morris Rd
- 30 Sp Rogers Ln
- 2175 Morris Rd
- 1985 Morris Rd
- 120 Sp Rogers Ln
- 2625 Morris Rd