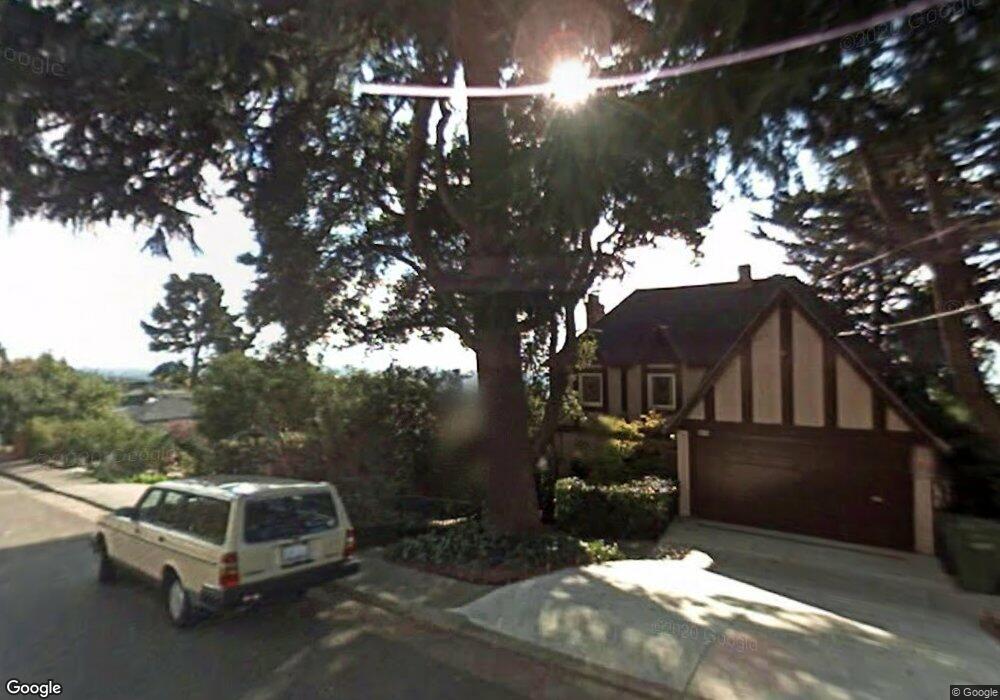
876 Spruce St Berkeley, CA 94707
Berkeley Hills NeighborhoodEstimated Value: $1,961,000 - $2,287,000
3
Beds
2
Baths
2,236
Sq Ft
$982/Sq Ft
Est. Value
About This Home
This home is located at 876 Spruce St, Berkeley, CA 94707 and is currently estimated at $2,196,560, approximately $982 per square foot. 876 Spruce St is a home located in Alameda County with nearby schools including Cragmont Elementary School, Berkeley Arts Magnet at Whittier School, and Washington Elementary School.
Ownership History
Date
Name
Owned For
Owner Type
Purchase Details
Closed on
Nov 30, 2020
Sold by
Jackson Shannon
Bought by
Jackson Shannon
Current Estimated Value
Home Financials for this Owner
Home Financials are based on the most recent Mortgage that was taken out on this home.
Original Mortgage
$910,000
Outstanding Balance
$810,171
Interest Rate
2.7%
Mortgage Type
New Conventional
Estimated Equity
$1,386,389
Purchase Details
Closed on
Mar 14, 2019
Sold by
Horn Thomas and Matheus Silvia
Bought by
Jackson Shannon
Purchase Details
Closed on
Mar 13, 2019
Sold by
Korcuska Michael
Bought by
Jackson Shannon
Purchase Details
Closed on
Jun 7, 2006
Sold by
Horn Thomas and Matheus Silvia
Bought by
Horn Thomas and Matheus Silvia
Create a Home Valuation Report for This Property
The Home Valuation Report is an in-depth analysis detailing your home's value as well as a comparison with similar homes in the area
Home Values in the Area
Average Home Value in this Area
Purchase History
| Date | Buyer | Sale Price | Title Company |
|---|---|---|---|
| Jackson Shannon | -- | First American Title Company | |
| Jackson Shannon | $1,810,000 | Chicago Title Company | |
| Jackson Shannon | -- | Chicago Title Company | |
| Horn Thomas | -- | None Available |
Source: Public Records
Mortgage History
| Date | Status | Borrower | Loan Amount |
|---|---|---|---|
| Open | Jackson Shannon | $910,000 |
Source: Public Records
Tax History
| Year | Tax Paid | Tax Assessment Tax Assessment Total Assessment is a certain percentage of the fair market value that is determined by local assessors to be the total taxable value of land and additions on the property. | Land | Improvement |
|---|---|---|---|---|
| 2025 | $28,252 | $2,012,054 | $605,716 | $1,413,338 |
| 2024 | $28,252 | $1,972,470 | $593,841 | $1,385,629 |
| 2023 | $27,646 | $1,940,663 | $582,199 | $1,358,464 |
| 2022 | $27,169 | $1,895,617 | $570,785 | $1,331,832 |
| 2021 | $27,288 | $1,858,313 | $559,594 | $1,305,719 |
| 2020 | $26,026 | $1,846,200 | $553,860 | $1,292,340 |
| 2019 | $10,773 | $623,522 | $178,332 | $445,190 |
| 2018 | $10,551 | $611,298 | $174,836 | $436,462 |
| 2017 | $10,176 | $599,313 | $171,408 | $427,905 |
| 2016 | $9,784 | $587,564 | $168,048 | $419,516 |
| 2015 | $9,636 | $578,741 | $165,524 | $413,217 |
| 2014 | $9,534 | $567,405 | $162,282 | $405,123 |
Source: Public Records
Map
Nearby Homes
- 938 San Benito Rd
- 1004 Cragmont Ave
- 813 San Diego Rd
- 777 Cragmont Ave
- 962 Regal Rd
- 758 Spruce St
- 765 San Diego Rd
- 1106 Cragmont Ave
- 2315 Eunice St
- 935 Grizzly Peak Blvd
- 2121 Eunice St
- 1983 Yosemite Rd
- 1024 Grizzly Peak Blvd
- 1950 Hopkins St
- 614 Cragmont Ave
- 606 Grizzly Peak Blvd
- 1085 Creston Rd
- 1165 Cragmont Ave
- 1110 Sterling Ave
- 1155 Keeler Ave
- 866 Spruce St
- 878 Spruce St
- 860 Spruce St
- 880 Spruce St
- 890 Spruce St
- 850 Spruce St
- 889 Santa Barbara Rd
- 869 Santa Barbara Rd
- 893 Santa Barbara Rd
- 863 Santa Barbara Rd
- 844 Spruce St
- 2275 Marin Ave
- 861 Santa Barbara Rd
- 882 Santa Barbara Rd
- 876 Santa Barbara Rd
- 902 Spruce St
- 900 Spruce St
- 870 Santa Barbara Rd
- 855 Santa Barbara Rd
- 901 Santa Barbara Rd
Your Personal Tour Guide
Ask me questions while you tour the home.