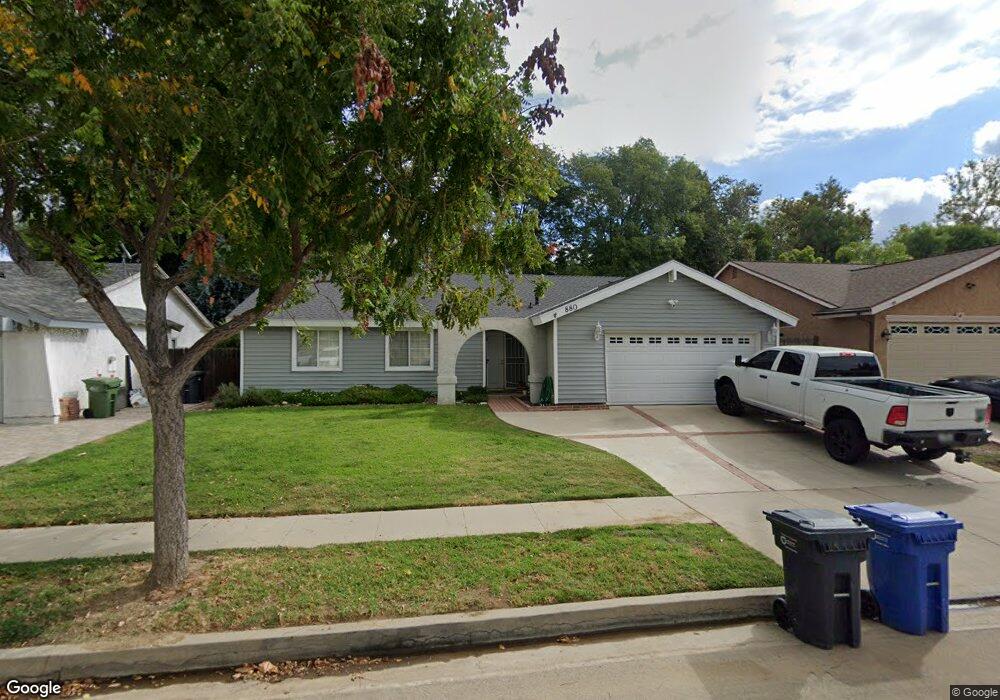
880 Ashford St Simi Valley, CA 93065
Central Simi Valley NeighborhoodEstimated Value: $787,000 - $867,000
3
Beds
2
Baths
1,363
Sq Ft
$605/Sq Ft
Est. Value
About This Home
This home is located at 880 Ashford St, Simi Valley, CA 93065 and is currently estimated at $824,622, approximately $605 per square foot. 880 Ashford St is a home located in Ventura County with nearby schools including Crestview Elementary School, Hillside Middle School, and Royal High School.
Ownership History
Date
Name
Owned For
Owner Type
Purchase Details
Closed on
Feb 10, 2008
Sold by
Chabot Billie L
Bought by
Balogh Denise
Current Estimated Value
Home Financials for this Owner
Home Financials are based on the most recent Mortgage that was taken out on this home.
Original Mortgage
$275,500
Outstanding Balance
$167,782
Interest Rate
5.41%
Mortgage Type
Purchase Money Mortgage
Estimated Equity
$656,840
Purchase Details
Closed on
Jan 10, 2003
Sold by
Va
Bought by
Chabot Billie L
Home Financials for this Owner
Home Financials are based on the most recent Mortgage that was taken out on this home.
Original Mortgage
$210,000
Interest Rate
5.83%
Purchase Details
Closed on
Mar 10, 1998
Sold by
John Chabot Robert
Bought by
Chabot Billie L
Purchase Details
Closed on
Mar 2, 1995
Sold by
Marlow Gene C and Marlow Kathryn L
Bought by
Va
Create a Home Valuation Report for This Property
The Home Valuation Report is an in-depth analysis detailing your home's value as well as a comparison with similar homes in the area
Home Values in the Area
Average Home Value in this Area
Purchase History
| Date | Buyer | Sale Price | Title Company |
|---|---|---|---|
| Balogh Denise | $375,500 | Chicago Title Company | |
| Chabot Billie L | -- | Commonwealth Land Title Co | |
| Chabot Billie L | -- | -- | |
| Va | $185,000 | Fidelity National Title |
Source: Public Records
Mortgage History
| Date | Status | Borrower | Loan Amount |
|---|---|---|---|
| Open | Balogh Denise | $275,500 | |
| Previous Owner | Chabot Billie L | $210,000 |
Source: Public Records
Tax History
| Year | Tax Paid | Tax Assessment Tax Assessment Total Assessment is a certain percentage of the fair market value that is determined by local assessors to be the total taxable value of land and additions on the property. | Land | Improvement |
|---|---|---|---|---|
| 2025 | $6,036 | $493,211 | $320,491 | $172,720 |
| 2024 | $6,036 | $483,541 | $314,207 | $169,334 |
| 2023 | $5,675 | $474,060 | $308,046 | $166,014 |
| 2022 | $5,650 | $464,765 | $302,006 | $162,759 |
| 2021 | $5,608 | $455,652 | $296,084 | $159,568 |
| 2020 | $5,491 | $450,982 | $293,049 | $157,933 |
| 2019 | $5,241 | $442,140 | $287,303 | $154,837 |
| 2018 | $5,195 | $433,471 | $281,670 | $151,801 |
| 2017 | $5,079 | $424,973 | $276,148 | $148,825 |
| 2016 | $4,851 | $416,641 | $270,734 | $145,907 |
| 2015 | $4,748 | $410,384 | $266,668 | $143,716 |
| 2014 | $4,680 | $402,347 | $261,446 | $140,901 |
Source: Public Records
Map
Nearby Homes
- 2490 Invar Ct
- 2339 Rudolph Dr
- 714 Appleton Rd
- 2098 Covington Ave
- 2044 Covington Ave
- 951 Vallejo Ave
- 1276 Roberta Ct
- 1091 Vallejo Ave
- 1995 Covington Ave
- 969 Roldan Ave
- 2407 Elizondo Ave
- 1135 Donner Ave
- 1917 Fitzgerald Rd
- 2783 Fallon Cir
- 2025 Royal Ave
- 2968 Royal Ave
- 2267 Morley St
- 2915 Deacon St Unit 17
- 1290 Lawrence Cir
- 1636 Earl Ave
- 898 Ashford St
- 868 Ashford St
- 912 Ashford St
- 965 Planetree Ave
- 879 Ashford St
- 950 Ashford St
- 844 Ashford St
- 897 Ashford St
- 867 Ashford St
- 911 Ashford St
- 855 Ashford St
- 977 Planetree Ave
- 832 Ashford St
- 843 Ashford St
- 949 Ashford St
- 981 Planetree Ave
- 967 Ashford St
- 978 Ashford St
- 831 Ashford St
- 989 Planetree Ave
Your Personal Tour Guide
Ask me questions while you tour the home.