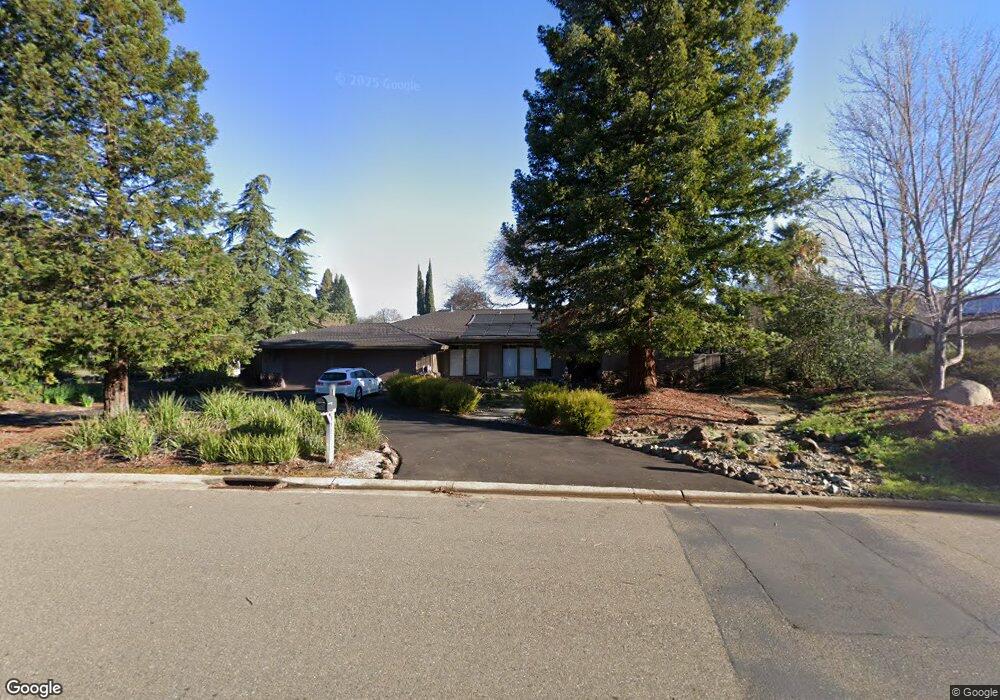
8801 Curragh Downs Dr Fair Oaks, CA 95628
Estimated Value: $815,000 - $981,000
4
Beds
3
Baths
2,429
Sq Ft
$359/Sq Ft
Est. Value
About This Home
This home is located at 8801 Curragh Downs Dr, Fair Oaks, CA 95628 and is currently estimated at $872,836, approximately $359 per square foot. 8801 Curragh Downs Dr is a home located in Sacramento County with nearby schools including Earl Legette Elementary School, Andrew Carnegie Middle School, and Bella Vista High School.
Ownership History
Date
Name
Owned For
Owner Type
Purchase Details
Closed on
Nov 16, 2011
Sold by
Sungar David Clay and Johnson Gayle E
Bought by
Sungar David Clay and Johnson Gayle E
Current Estimated Value
Purchase Details
Closed on
Aug 2, 2004
Sold by
Sungar Gayle Johnson and Sungar Clay
Bought by
Sungar David Clay and Johnson Gayle E
Purchase Details
Closed on
Jun 25, 2002
Sold by
Anderson Scott E and Anderson Carol M
Bought by
Johnson Sungar Clay and Johnson Sungar Gayle
Home Financials for this Owner
Home Financials are based on the most recent Mortgage that was taken out on this home.
Original Mortgage
$270,000
Outstanding Balance
$114,565
Interest Rate
6.86%
Estimated Equity
$758,271
Create a Home Valuation Report for This Property
The Home Valuation Report is an in-depth analysis detailing your home's value as well as a comparison with similar homes in the area
Home Values in the Area
Average Home Value in this Area
Purchase History
| Date | Buyer | Sale Price | Title Company |
|---|---|---|---|
| Sungar David Clay | -- | None Available | |
| Sungar David Clay | -- | None Available | |
| Sungar David Clay | -- | -- | |
| Johnson Sungar Clay | $460,500 | Chicago Title Co |
Source: Public Records
Mortgage History
| Date | Status | Borrower | Loan Amount |
|---|---|---|---|
| Open | Johnson Sungar Clay | $270,000 | |
| Closed | Johnson Sungar Clay | $60,000 |
Source: Public Records
Tax History
| Year | Tax Paid | Tax Assessment Tax Assessment Total Assessment is a certain percentage of the fair market value that is determined by local assessors to be the total taxable value of land and additions on the property. | Land | Improvement |
|---|---|---|---|---|
| 2025 | $7,958 | $666,379 | $166,548 | $499,831 |
| 2024 | $7,958 | $653,314 | $163,283 | $490,031 |
| 2023 | $7,719 | $640,505 | $160,082 | $480,423 |
| 2022 | $7,689 | $627,947 | $156,944 | $471,003 |
| 2021 | $7,546 | $615,635 | $153,867 | $461,768 |
| 2020 | $7,438 | $609,324 | $152,290 | $457,034 |
| 2019 | $7,248 | $597,377 | $149,304 | $448,073 |
| 2018 | $7,088 | $585,665 | $146,377 | $439,288 |
| 2017 | $7,016 | $574,182 | $143,507 | $430,675 |
| 2016 | $6,553 | $562,925 | $140,694 | $422,231 |
| 2015 | $6,440 | $554,470 | $138,581 | $415,889 |
| 2014 | $6,304 | $543,610 | $135,867 | $407,743 |
Source: Public Records
Map
Nearby Homes
- 4198 Riva Ridge Dr
- 8764 Bluff Ln
- 8749 Noland Ln
- 8899 Bluff Ln
- 4330 Hale Ranch Ln
- 8924 Visage Cir
- 8804 N Winding Way
- 8833 Winding Way
- 4257 Winding Woods Way
- 8681 Winding Way
- 8574 Willings Way
- 8572 Oakview Ln
- 12104 Gold Pointe Ln
- 8688 Fruitwood Ct
- 12129 Gold Bluff Ln
- 11939 Old Eureka Way
- 11931 Old Eureka Way
- 4416 Kenneth Ave
- 11909 Rising Sun Way
- 11950 Rising Sun Way
- 4100 Thistledown Dr
- 8811 Curragh Downs Dr
- 8808 Bold Ruler Way
- 8812 Bold Ruler Way
- 4110 Thistledown Dr
- 4193 Riva Ridge Dr
- 8804 Bold Ruler Way
- 8800 Curragh Downs Dr
- 4101 Thistledown Dr
- 8816 Bold Ruler Way
- 8771 Curragh Downs Dr
- 8821 Curragh Downs Dr
- 8800 Bold Ruler Way
- 8810 Curragh Downs Dr
- 4111 Thistledown Dr
- 8807 Bold Ruler Way
- 8820 Bold Ruler Way
- 8770 Curragh Downs Dr
- 8817 Bold Ruler Way
- 8801 Bold Ruler Way
Your Personal Tour Guide
Ask me questions while you tour the home.