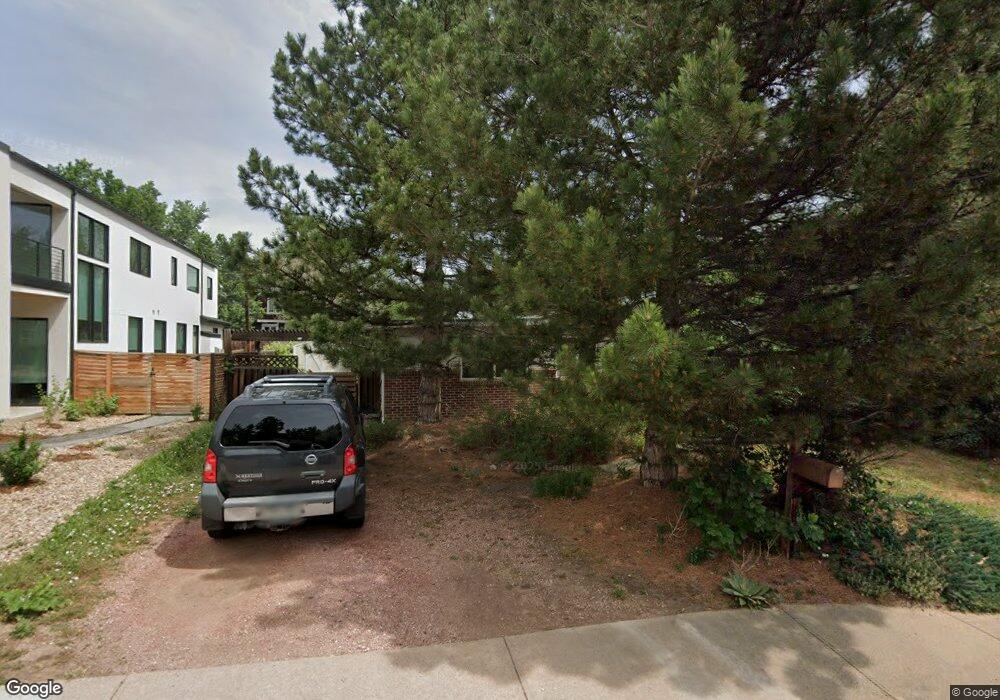
885 Grape Ave Boulder, CO 80304
Newlands NeighborhoodEstimated Value: $1,033,000 - $1,388,000
3
Beds
2
Baths
1,575
Sq Ft
$778/Sq Ft
Est. Value
About This Home
This home is located at 885 Grape Ave, Boulder, CO 80304 and is currently estimated at $1,224,889, approximately $777 per square foot. 885 Grape Ave is a home located in Boulder County with nearby schools including Foothill Elementary School, Casey Middle School, and Boulder High School.
Ownership History
Date
Name
Owned For
Owner Type
Purchase Details
Closed on
Jan 5, 2018
Sold by
Ploog Barry
Bought by
Palmos Soterios
Current Estimated Value
Purchase Details
Closed on
May 4, 1992
Bought by
Dacey Christopher A
Create a Home Valuation Report for This Property
The Home Valuation Report is an in-depth analysis detailing your home's value as well as a comparison with similar homes in the area
Home Values in the Area
Average Home Value in this Area
Purchase History
| Date | Buyer | Sale Price | Title Company |
|---|---|---|---|
| Palmos Soterios | $685,000 | Land Title Guarantee Co | |
| Dacey Christopher A | $115,000 | -- |
Source: Public Records
Tax History Compared to Growth
Tax History
| Year | Tax Paid | Tax Assessment Tax Assessment Total Assessment is a certain percentage of the fair market value that is determined by local assessors to be the total taxable value of land and additions on the property. | Land | Improvement |
|---|---|---|---|---|
| 2025 | $7,055 | $73,812 | $66,431 | $7,381 |
| 2024 | $7,055 | $73,812 | $66,431 | $7,381 |
| 2023 | $6,932 | $80,273 | $75,562 | $8,396 |
| 2022 | $5,918 | $63,731 | $57,358 | $6,373 |
| 2021 | $5,644 | $65,566 | $59,009 | $6,557 |
| 2020 | $5,189 | $59,610 | $47,691 | $11,919 |
| 2019 | $5,109 | $59,610 | $47,691 | $11,919 |
| 2018 | $4,815 | $55,541 | $44,424 | $11,117 |
| 2017 | $4,665 | $61,403 | $49,113 | $12,290 |
| 2016 | $4,189 | $48,397 | $38,447 | $9,950 |
| 2015 | $3,967 | $40,588 | $21,174 | $19,414 |
| 2014 | $3,413 | $40,588 | $21,174 | $19,414 |
Source: Public Records
Map
Nearby Homes
- 711 Hawthorn Ave
- 864 Iris Ave
- 1023 Forest Ave
- 560 Iris Ave
- 3080 7th St
- 1070 Juniper Ave
- 503 Hawthorn Ave
- 3315 Broadway St
- 706 Juniper Ave
- 3189 5th St
- 3319 Broadway
- 3056 8th St
- 1172 Juniper Ave
- 1127 Juniper Ave
- 3025 Broadway St Unit 7
- 910 Kalmia Ave
- 2958 6th St
- 1237 Elder Ave Unit 1
- 855 Kalmia Ave
- 3561 4th St