
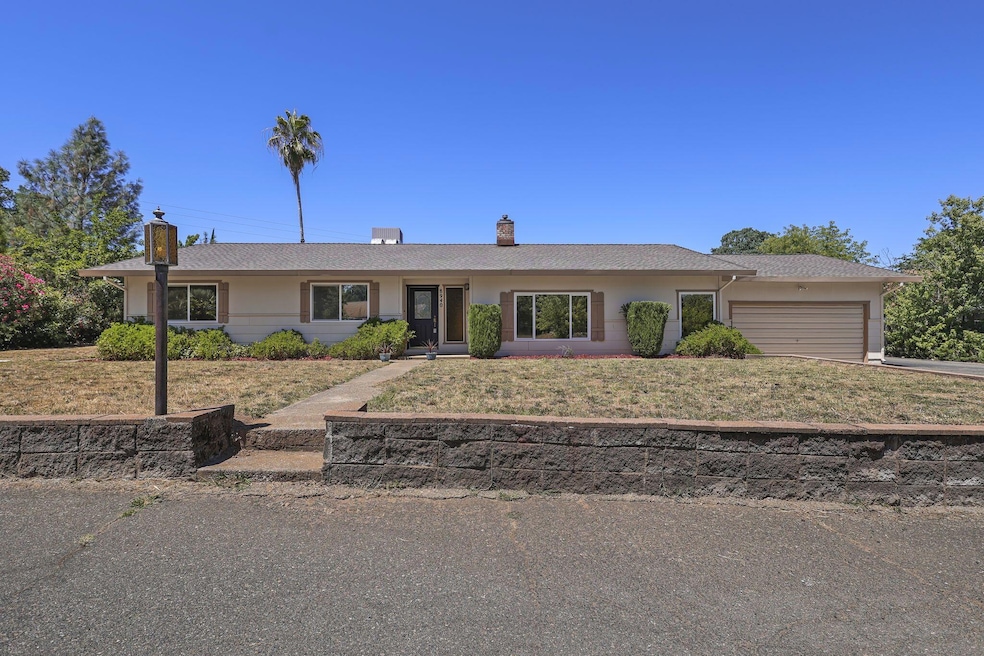


8940 Olney Park Dr Redding, CA 96001
Centerville Neighborhood
3
Beds
2
Baths
1,779
Sq Ft
1.08
Acres
Highlights
- Parking available for a boat
- Mountain View
- No HOA
- Grant Elementary School Rated A
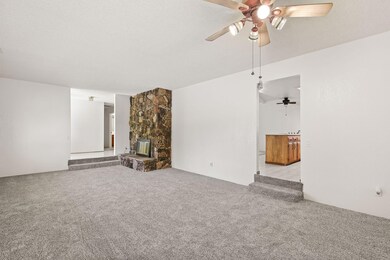
- Wood Burning Stove
- Fireplace
About This Home
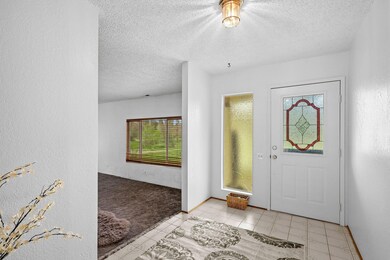
As of August 2023This home keeps getting BETTER AND BETTER! New Roof, rebuilt septic, new flooring throughout!
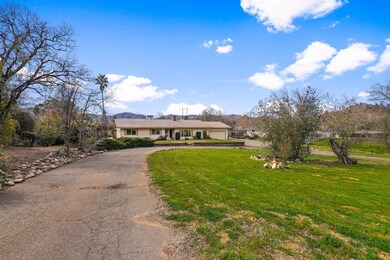
Get some room to roam on this 1+ acre property! Minutes from downtown but it feels like the country. Enjoy beautiful mountain views and sunsets from the covered deck while you relax around the pool. The home is 1,779 sf with a separate living and family room. 3 bedrooms, 2 baths. Great big permitted shop in the rear of the property for projects or storage of your big toys!
Lots of yard, front and back for animals or landscaping. Excellent Grant school district.
Last Agent to Sell the Property
Trish Elste
Compass California 11, Inc License #01950415 Listed on: 07/13/2023
Home Details
Home Type
- Single Family
Est. Annual Taxes
- $4,612
Year Built
- Built in 1976
Lot Details
- 1.08 Acre Lot
Home Design
- Ranch Property
- Raised Foundation
- Composite Building Materials
Interior Spaces
- 1,779 Sq Ft Home
- 1-Story Property
- Fireplace
- Wood Burning Stove
- Mountain Views
Bedrooms and Bathrooms
- 3 Bedrooms
- 2 Full Bathrooms
Parking
- Oversized Parking
- Off-Street Parking
- Parking available for a boat
- RV Access or Parking
Utilities
- Cooling Available
- Heat Pump System
- Septic Tank
Community Details
- No Home Owners Association
Listing and Financial Details
- Assessor Parcel Number 203-060-030-000
Ownership History
Date
Name
Owned For
Owner Type
Purchase Details
Listed on
Jul 13, 2023
Closed on
Aug 22, 2023
Sold by
Barbara J Webb Trust
Bought by
Feeney Sean and Feeney Estephanie
Seller's Agent
Trish Elste
Compass California 11, Inc
Buyer's Agent
Chad Phillips
Shasta Sotheby's International Realty
List Price
$449,000
Sold Price
$420,000
Premium/Discount to List
-$29,000
-6.46%
Views
26
Home Financials for this Owner
Home Financials are based on the most recent Mortgage that was taken out on this home.
Avg. Annual Appreciation
11.81%
Original Mortgage
$336,000
Outstanding Balance
$329,506
Interest Rate
6.96%
Mortgage Type
New Conventional
Estimated Equity
$186,855
Purchase Details
Closed on
Jun 20, 2014
Sold by
Webb Barbara J and Brashear Barbara J
Bought by
Webb Barbara J
Similar Homes in Redding, CA
Create a Home Valuation Report for This Property
The Home Valuation Report is an in-depth analysis detailing your home's value as well as a comparison with similar homes in the area
Home Values in the Area
Average Home Value in this Area
Purchase History
| Date | Type | Sale Price | Title Company |
|---|---|---|---|
| Grant Deed | $420,000 | First American Title | |
| Interfamily Deed Transfer | -- | None Available |
Source: Public Records
Mortgage History
| Date | Status | Loan Amount | Loan Type |
|---|---|---|---|
| Open | $336,000 | New Conventional | |
| Previous Owner | $82,000 | Credit Line Revolving |
Source: Public Records
Property History
| Date | Event | Price | Change | Sq Ft Price |
|---|---|---|---|---|
| 07/14/2025 07/14/25 | Price Changed | $499,999 | -4.7% | $281 / Sq Ft |
| 07/03/2025 07/03/25 | Price Changed | $524,900 | -4.4% | $295 / Sq Ft |
| 05/27/2025 05/27/25 | Price Changed | $549,000 | -4.5% | $309 / Sq Ft |
| 04/10/2025 04/10/25 | Price Changed | $575,000 | -3.8% | $323 / Sq Ft |
| 03/13/2025 03/13/25 | Price Changed | $598,000 | -3.2% | $336 / Sq Ft |
| 02/20/2025 02/20/25 | For Sale | $618,000 | +47.1% | $347 / Sq Ft |
| 02/04/2025 02/04/25 | Off Market | $420,000 | -- | -- |
| 08/28/2023 08/28/23 | Sold | $420,000 | 0.0% | $236 / Sq Ft |
| 08/28/2023 08/28/23 | Sold | $420,000 | 0.0% | $236 / Sq Ft |
| 08/16/2023 08/16/23 | Pending | -- | -- | -- |
| 08/10/2023 08/10/23 | Pending | -- | -- | -- |
| 08/07/2023 08/07/23 | Off Market | $420,000 | -- | -- |
| 07/13/2023 07/13/23 | For Sale | $449,000 | 0.0% | $252 / Sq Ft |
| 07/13/2023 07/13/23 | Price Changed | $449,000 | 0.0% | $252 / Sq Ft |
| 07/13/2023 07/13/23 | Price Changed | $449,000 | +6.9% | $252 / Sq Ft |
| 06/28/2023 06/28/23 | Off Market | $420,000 | -- | -- |
| 06/17/2023 06/17/23 | Price Changed | $410,000 | 0.0% | $230 / Sq Ft |
| 06/17/2023 06/17/23 | For Sale | $410,000 | 0.0% | $230 / Sq Ft |
| 06/08/2023 06/08/23 | Price Changed | $410,000 | +1.2% | $230 / Sq Ft |
| 06/08/2023 06/08/23 | For Sale | $405,000 | -3.6% | $228 / Sq Ft |
| 05/08/2023 05/08/23 | Pending | -- | -- | -- |
| 04/21/2023 04/21/23 | Pending | -- | -- | -- |
| 04/20/2023 04/20/23 | Off Market | $420,000 | -- | -- |
| 04/15/2023 04/15/23 | For Sale | $405,000 | 0.0% | $228 / Sq Ft |
| 03/31/2023 03/31/23 | For Sale | $405,000 | -- | $228 / Sq Ft |
Source: Shasta Association of REALTORS®
Tax History Compared to Growth
Tax History
| Year | Tax Paid | Tax Assessment Tax Assessment Total Assessment is a certain percentage of the fair market value that is determined by local assessors to be the total taxable value of land and additions on the property. | Land | Improvement |
|---|---|---|---|---|
| 2025 | $4,612 | $428,400 | $91,800 | $336,600 |
| 2024 | $4,406 | $420,000 | $90,000 | $330,000 |
| 2023 | $4,406 | $400,000 | $90,000 | $310,000 |
| 2022 | $1,976 | $186,258 | $21,673 | $164,585 |
| 2021 | $1,935 | $182,607 | $21,249 | $161,358 |
| 2020 | $2,032 | $180,736 | $21,032 | $159,704 |
| 2019 | $1,943 | $177,193 | $20,620 | $156,573 |
| 2018 | $2,044 | $173,719 | $20,216 | $153,503 |
| 2017 | $1,882 | $170,314 | $19,820 | $150,494 |
| 2016 | $1,834 | $166,976 | $19,432 | $147,544 |
| 2015 | $1,806 | $164,469 | $19,141 | $145,328 |
| 2014 | -- | $161,249 | $18,767 | $142,482 |
Source: Public Records
Agents Affiliated with this Home
-
Estephanie Feeney
E
Seller's Agent in 2025
Estephanie Feeney
Shasta Sotheby's International Realty
(530) 604-3951
2 in this area
11 Total Sales
-
Trish Elste
Seller's Agent in 2023
Trish Elste
Compass
(925) 322-7509
1 in this area
23 Total Sales
-
O
Buyer's Agent in 2023
OUT OF AREA OUT
OUT OF AREA - NON MEMBER
-
Chad Phillips
Buyer's Agent in 2023
Chad Phillips
Shasta Sotheby's International Realty
(530) 921-2586
8 in this area
137 Total Sales
Map
Source: Shasta Association of REALTORS®
MLS Number: 23-1100
APN: 203-060-030-000
Disclaimer: Certain information contained herein is derived from information provided by parties other than Homes.com. All information provided is deemed reliable, but is not guaranteed to be accurate and should be independently verified.
![]() IDX information is provided exclusively for personal, non-commercial use, and may not be used for any purpose other than to identify prospective properties consumers may be interested in purchasing. Information is deemed reliable but not guaranteed.
IDX information is provided exclusively for personal, non-commercial use, and may not be used for any purpose other than to identify prospective properties consumers may be interested in purchasing. Information is deemed reliable but not guaranteed.
Nearby Homes
- 8928 Olney Park Dr
- 16160 Plateau Cir
- 16123 Plateau Cir
- 9200 Silver King Rd
- 16322 Towerview Cir
- 0 Silver King Rd Unit 25-1825
- 9047 Swasey Dr
- 15842 Macleod Dr
- 9472 Chaparral Dr
- 0 Chaparral Dr
- 8826 Heritage Ct
- 9400 Placer Rd
- 9504 Rattlesnake Ln
- 9329 Irish Creek Ln
- 8499 Simmons Rd
- 16550 Celtic Ct
- 005 Celtic Ct
- 16520 Blarney Ln
- 8846 Goldstone Ln
- 4824 Aloe Vera Dr