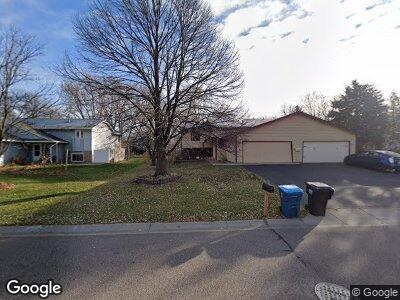
8952 Magnolia Ln N Maple Grove, MN 55369
Estimated Value: $282,000 - $309,000
3
Beds
2
Baths
1,815
Sq Ft
$163/Sq Ft
Est. Value
About This Home
This home is located at 8952 Magnolia Ln N, Maple Grove, MN 55369 and is currently estimated at $295,568, approximately $162 per square foot. 8952 Magnolia Ln N is a home located in Hennepin County with nearby schools including Rice Lake Elementary School, Osseo Middle School, and Maple Grove Senior High School.
Ownership History
Date
Name
Owned For
Owner Type
Purchase Details
Closed on
May 21, 2021
Sold by
Mindiola John and Mindiola Tracy
Bought by
Li Jinyu and Zhang Yani
Current Estimated Value
Home Financials for this Owner
Home Financials are based on the most recent Mortgage that was taken out on this home.
Original Mortgage
$191,250
Outstanding Balance
$175,514
Interest Rate
3.1%
Mortgage Type
New Conventional
Estimated Equity
$120,054
Purchase Details
Closed on
Jul 30, 2020
Sold by
Wallace Barton L and Wallace Kathleen N
Bought by
Mindiola John and Mindiola Tracy
Home Financials for this Owner
Home Financials are based on the most recent Mortgage that was taken out on this home.
Original Mortgage
$243,470
Interest Rate
3%
Mortgage Type
New Conventional
Create a Home Valuation Report for This Property
The Home Valuation Report is an in-depth analysis detailing your home's value as well as a comparison with similar homes in the area
Home Values in the Area
Average Home Value in this Area
Purchase History
| Date | Buyer | Sale Price | Title Company |
|---|---|---|---|
| Li Jinyu | $261,000 | Title Specialists Inc | |
| Mindiola John | $251,000 | Title Specialists Inc | |
| Li Jinyu Jinyu | $261,000 | -- |
Source: Public Records
Mortgage History
| Date | Status | Borrower | Loan Amount |
|---|---|---|---|
| Open | Li Jinyu | $191,250 | |
| Previous Owner | Mindiola John | $243,470 | |
| Previous Owner | Wallace Barton L | $84,800 | |
| Previous Owner | Wallace Barton | $88,000 | |
| Closed | Li Jinyu Jinyu | $191,250 |
Source: Public Records
Tax History Compared to Growth
Tax History
| Year | Tax Paid | Tax Assessment Tax Assessment Total Assessment is a certain percentage of the fair market value that is determined by local assessors to be the total taxable value of land and additions on the property. | Land | Improvement |
|---|---|---|---|---|
| 2023 | $3,019 | $267,700 | $66,100 | $201,600 |
| 2022 | $2,690 | $259,900 | $53,600 | $206,300 |
| 2021 | $2,830 | $234,900 | $48,600 | $186,300 |
| 2020 | $2,909 | $226,600 | $45,900 | $180,700 |
| 2019 | $2,807 | $208,300 | $45,600 | $162,700 |
| 2018 | $2,398 | $189,200 | $45,600 | $143,600 |
| 2017 | $2,364 | $147,700 | $35,000 | $112,700 |
| 2016 | $2,300 | $154,800 | $36,500 | $118,300 |
| 2015 | $1,993 | $130,500 | $32,500 | $98,000 |
| 2014 | -- | $127,700 | $37,000 | $90,700 |
Source: Public Records
Map
Nearby Homes
- 8941 Oakview Ln N
- 12121 87th Ave N
- 11726 88th Ave N
- 13570 89th Ave N
- 9155 Goldenrod Ln N
- 12360 85th Place N
- 11891 85th Place N
- 8445 Forestview Ln N
- 8401 Forestview Ln N
- 8301 Norwood Ln N
- 8403 Larch Ln N
- 8307 Norwood Ln N
- 8362 Jonquil Ln N
- 11614 83rd Place N
- 13400 91st Place N
- 8619 Wedgwood Ln N
- 12612 95th Place N
- 12686 82nd Place N
- 13285 94th Ave N
- 8566 Xenium Ln N
- 8952 Magnolia Ln N
- 8952 8952 Magnolia-Lane-n
- 8946 Magnolia Ln N
- 8964 Magnolia Ln N
- 8932 Magnolia Ln N
- 8951 Kirkwood Cir N
- 8932 8932 Magnolia-Lane-n
- 8963 Kirkwood Cir N
- 8928 8928 Magnolia-Lane-n
- 8939 Kirkwood Cir N
- 8972 Magnolia Ln N
- 8928 Magnolia Ln N
- 8951 Magnolia Ln N
- 8931 Kirkwood Cir N
- 8945 Magnolia Ln N
- 8975 Kirkwood Cir N
- 8969 Magnolia Ln N
- 8931 Magnolia Ln N
- 8916 Magnolia Ln N
- 8988 Magnolia Ln N