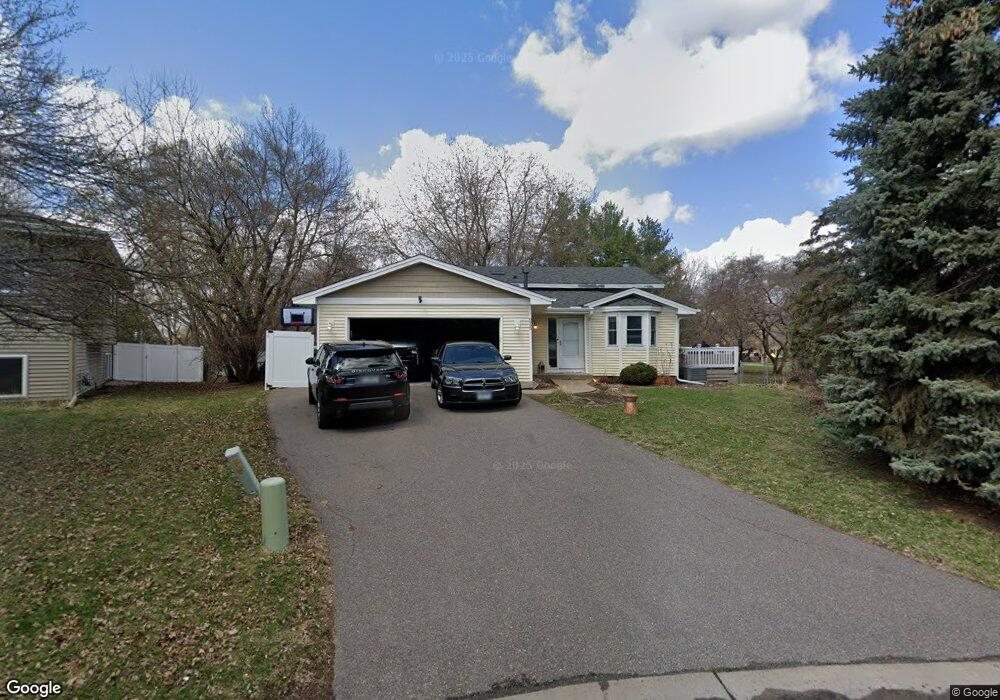
8999 Yucca Ln N Maple Grove, MN 55369
Estimated Value: $398,000 - $421,000
4
Beds
2
Baths
1,132
Sq Ft
$360/Sq Ft
Est. Value
About This Home
This home is located at 8999 Yucca Ln N, Maple Grove, MN 55369 and is currently estimated at $407,510, approximately $359 per square foot. 8999 Yucca Ln N is a home located in Hennepin County with nearby schools including Rice Lake Elementary School, Osseo Middle School, and Maple Grove Senior High School.
Ownership History
Date
Name
Owned For
Owner Type
Purchase Details
Closed on
Jun 24, 2016
Sold by
Kersting Eric S and Kersting Ashley L
Bought by
Diaz Rolando and Diaz Nicole
Current Estimated Value
Home Financials for this Owner
Home Financials are based on the most recent Mortgage that was taken out on this home.
Original Mortgage
$251,853
Outstanding Balance
$200,773
Interest Rate
3.62%
Mortgage Type
FHA
Estimated Equity
$206,737
Purchase Details
Closed on
Aug 28, 2008
Sold by
Winker Companies Llc
Bought by
Kersting Eric S and Kersting Ashley L
Purchase Details
Closed on
Sep 29, 2005
Sold by
Spillers Scott M and Spillers Kelli J
Bought by
Winker Fredrick E
Create a Home Valuation Report for This Property
The Home Valuation Report is an in-depth analysis detailing your home's value as well as a comparison with similar homes in the area
Home Values in the Area
Average Home Value in this Area
Purchase History
| Date | Buyer | Sale Price | Title Company |
|---|---|---|---|
| Diaz Rolando | $256,500 | Gibraltar Title Agency Llc | |
| Kersting Eric S | $180,000 | -- | |
| Winker Fredrick E | $284,000 | -- |
Source: Public Records
Mortgage History
| Date | Status | Borrower | Loan Amount |
|---|---|---|---|
| Open | Diaz Rolando | $251,853 |
Source: Public Records
Tax History Compared to Growth
Tax History
| Year | Tax Paid | Tax Assessment Tax Assessment Total Assessment is a certain percentage of the fair market value that is determined by local assessors to be the total taxable value of land and additions on the property. | Land | Improvement |
|---|---|---|---|---|
| 2024 | $4,468 | $377,500 | $127,900 | $249,600 |
| 2023 | $4,443 | $381,100 | $125,900 | $255,200 |
| 2022 | $3,687 | $395,600 | $119,900 | $275,700 |
| 2021 | $3,372 | $311,400 | $89,600 | $221,800 |
| 2020 | $3,297 | $282,800 | $73,800 | $209,000 |
| 2019 | $3,392 | $264,400 | $63,000 | $201,400 |
| 2018 | $2,985 | $257,600 | $72,000 | $185,600 |
| 2017 | $2,904 | $213,000 | $56,500 | $156,500 |
| 2016 | $3,394 | $222,400 | $74,500 | $147,900 |
| 2015 | $3,224 | $206,600 | $62,500 | $144,100 |
| 2014 | -- | $192,400 | $62,500 | $129,900 |
Source: Public Records
Map
Nearby Homes
- 13590 89th Ave N
- 9061 Underwood Ln N
- 8949 Rosewood Ln N
- 13885 93rd Place N
- 14402 91st Place N
- 13744 94th Ave N
- 8567 Xenium Ln N
- 8735 Rosewood Ln N
- 13898 85th Place N
- 12769 88th Ave N
- 9421 Dallas Ln N
- 14085 85th Place N
- 13870 85th Ave N
- 8473 Rice Lake Rd
- 12599 91st Place N
- 14624 92nd Place N
- 10625 Juneau Ln N
- 8461 Rice Lake Rd
- 13667 84th Place N
- 13773 84th Place N
- 8987 Yucca Ln N
- 13640 89th Place N
- 8950 Zinnia Ln N
- 13691 90th Ave N
- 8975 Yucca Ln N
- 13756 89th Place N
- 8988 Yucca Ln N
- 13612 89th Place N
- 13737 90th Ave N
- 8942 Zinnia Ln N
- 8978 Yucca Ln N
- 8963 Yucca Ln N
- 13588 89th Place N
- 8934 Zinnia Ln N
- 13778 89th Place N
- 13775 90th Ave N
- 8966 Yucca Ln N
- 13577 89th Cir N
- 13700 90th Ave N
- 8949 Yucca Ln N