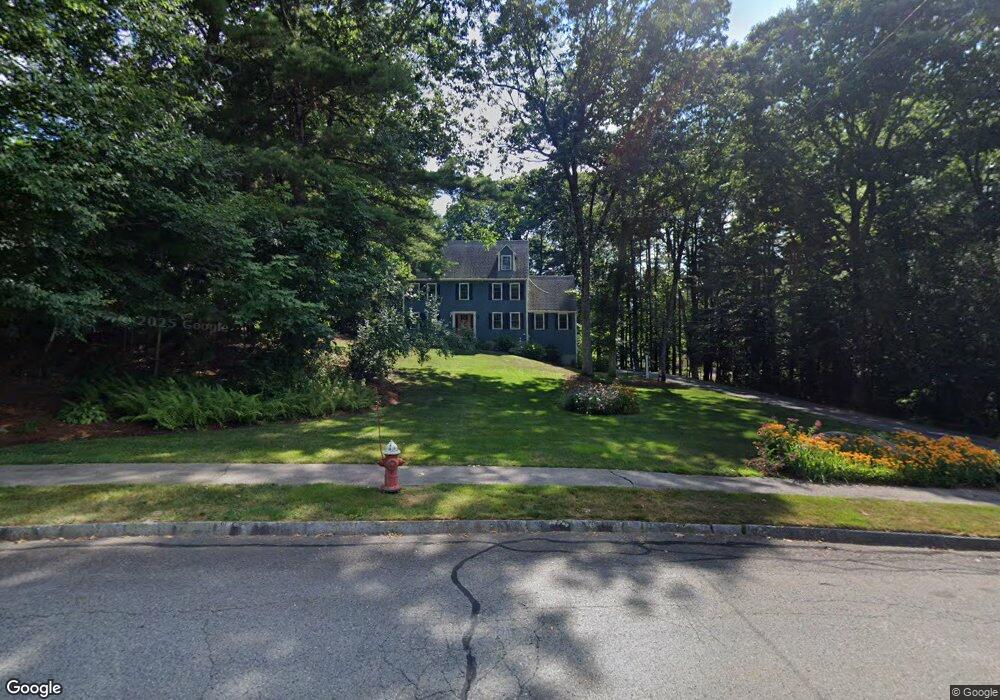
9 Geneseo Cir Milford, MA 01757
Estimated Value: $754,002 - $864,000
4
Beds
3
Baths
2,700
Sq Ft
$300/Sq Ft
Est. Value
About This Home
This home is located at 9 Geneseo Cir, Milford, MA 01757 and is currently estimated at $808,751, approximately $299 per square foot. 9 Geneseo Cir is a home located in Worcester County with nearby schools including Milford High School.
Ownership History
Date
Name
Owned For
Owner Type
Purchase Details
Closed on
Jun 25, 2019
Sold by
Hart Thomas G and Hart Suzanne M
Bought by
Hart Rt and Hart
Current Estimated Value
Purchase Details
Closed on
Oct 31, 2000
Sold by
Fagan Roy M and Fagan Joni A
Bought by
Hart Suzanne M and Hart Thomas G
Purchase Details
Closed on
Dec 15, 1999
Sold by
Fagan Roy M and Fagan Joni A
Bought by
Citizens Bank Mass
Purchase Details
Closed on
Apr 29, 1997
Sold by
Noe Gregory L and Noe Dana K
Bought by
Fagan Roy M and Fagan Joni A
Create a Home Valuation Report for This Property
The Home Valuation Report is an in-depth analysis detailing your home's value as well as a comparison with similar homes in the area
Home Values in the Area
Average Home Value in this Area
Purchase History
| Date | Buyer | Sale Price | Title Company |
|---|---|---|---|
| Hart Rt | -- | -- | |
| Hart Suzanne M | $335,000 | -- | |
| Citizens Bank Mass | $42,640 | -- | |
| Fagan Roy M | $236,000 | -- |
Source: Public Records
Mortgage History
| Date | Status | Borrower | Loan Amount |
|---|---|---|---|
| Previous Owner | Fagan Roy M | $84,000 | |
| Previous Owner | Fagan Roy M | $150,000 |
Source: Public Records
Tax History Compared to Growth
Tax History
| Year | Tax Paid | Tax Assessment Tax Assessment Total Assessment is a certain percentage of the fair market value that is determined by local assessors to be the total taxable value of land and additions on the property. | Land | Improvement |
|---|---|---|---|---|
| 2025 | $8,242 | $643,900 | $218,200 | $425,700 |
| 2024 | $8,136 | $612,200 | $209,500 | $402,700 |
| 2023 | $7,659 | $530,000 | $181,200 | $348,800 |
| 2022 | $7,212 | $468,600 | $165,900 | $302,700 |
| 2021 | $6,887 | $431,000 | $165,900 | $265,100 |
| 2020 | $6,804 | $426,300 | $165,900 | $260,400 |
| 2019 | $6,626 | $400,600 | $165,900 | $234,700 |
| 2018 | $6,563 | $396,300 | $161,600 | $234,700 |
| 2017 | $6,330 | $377,000 | $161,600 | $215,400 |
| 2016 | $6,233 | $362,800 | $161,600 | $201,200 |
| 2015 | $6,164 | $351,200 | $161,600 | $189,600 |
Source: Public Records
Map
Nearby Homes