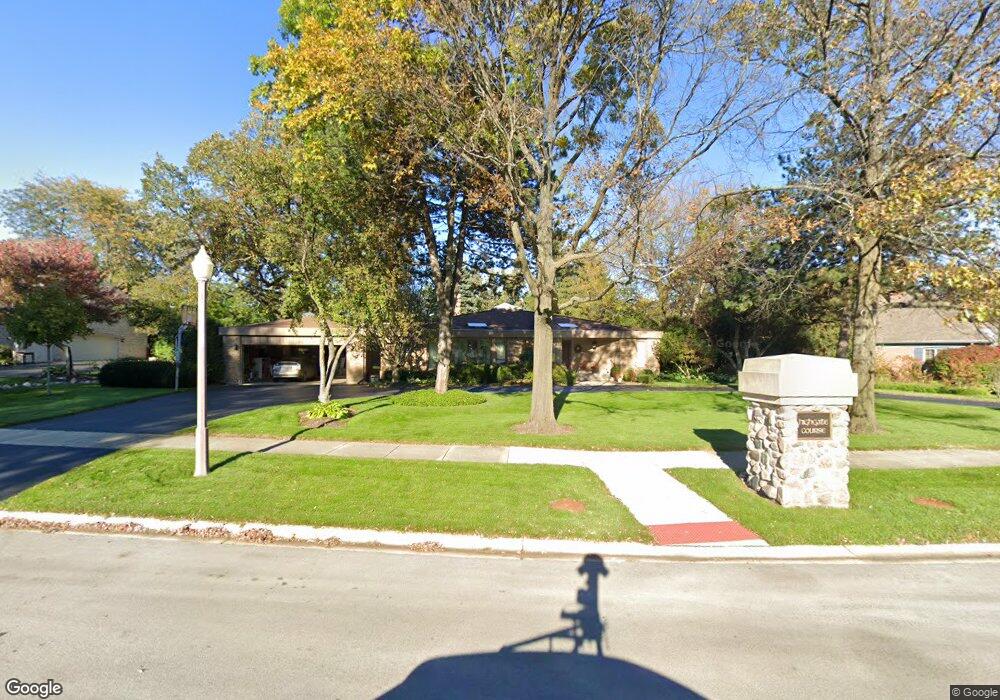
9 Highgate Course Saint Charles, IL 60174
Northeast Saint Charles NeighborhoodEstimated Value: $615,292 - $795,000
3
Beds
3
Baths
2,899
Sq Ft
$236/Sq Ft
Est. Value
About This Home
This home is located at 9 Highgate Course, Saint Charles, IL 60174 and is currently estimated at $685,323, approximately $236 per square foot. 9 Highgate Course is a home located in Kane County with nearby schools including Norton Creek Elementary School, Wredling Middle School, and St Charles East High School.
Ownership History
Date
Name
Owned For
Owner Type
Purchase Details
Closed on
May 6, 2025
Sold by
Klaric James J and Klaric Linda J
Bought by
James J Klaric And Linda J Klaric Living Trus and Klaric
Current Estimated Value
Purchase Details
Closed on
Dec 31, 2009
Sold by
Brennan Matthew P and Brennan Holly A
Bought by
Klaric James J and Klaric Linda J
Home Financials for this Owner
Home Financials are based on the most recent Mortgage that was taken out on this home.
Original Mortgage
$200,000
Interest Rate
4.84%
Mortgage Type
New Conventional
Purchase Details
Closed on
Mar 28, 2007
Sold by
Ludemann Mildred L
Bought by
Brennan Matthew P and Brennan Holly A
Home Financials for this Owner
Home Financials are based on the most recent Mortgage that was taken out on this home.
Original Mortgage
$395,000
Interest Rate
6.31%
Mortgage Type
Purchase Money Mortgage
Create a Home Valuation Report for This Property
The Home Valuation Report is an in-depth analysis detailing your home's value as well as a comparison with similar homes in the area
Home Values in the Area
Average Home Value in this Area
Purchase History
| Date | Buyer | Sale Price | Title Company |
|---|---|---|---|
| James J Klaric And Linda J Klaric Living Trus | -- | None Listed On Document | |
| Klaric James J | $405,000 | Ticor Title Insurance Co | |
| Brennan Matthew P | $495,000 | Chicago Title Insurance Co |
Source: Public Records
Mortgage History
| Date | Status | Borrower | Loan Amount |
|---|---|---|---|
| Previous Owner | Klaric James J | $200,000 | |
| Previous Owner | Brennan Matthew P | $395,000 |
Source: Public Records
Tax History
| Year | Tax Paid | Tax Assessment Tax Assessment Total Assessment is a certain percentage of the fair market value that is determined by local assessors to be the total taxable value of land and additions on the property. | Land | Improvement |
|---|---|---|---|---|
| 2024 | $10,826 | $161,835 | $37,240 | $124,595 |
| 2023 | $10,312 | $144,844 | $33,330 | $111,514 |
| 2022 | $9,641 | $130,400 | $36,155 | $94,245 |
| 2021 | $9,240 | $124,297 | $34,463 | $89,834 |
| 2020 | $9,566 | $127,226 | $33,820 | $93,406 |
| 2019 | $9,385 | $124,707 | $33,150 | $91,557 |
| 2018 | $9,693 | $127,858 | $32,541 | $95,317 |
| 2017 | $10,235 | $133,153 | $31,428 | $101,725 |
| 2016 | $10,732 | $128,476 | $30,324 | $98,152 |
| 2015 | -- | $118,786 | $29,997 | $88,789 |
| 2014 | -- | $111,914 | $29,997 | $81,917 |
| 2013 | -- | $116,909 | $30,297 | $86,612 |
Source: Public Records
Map
Nearby Homes
- 32 Dunham Place
- 22 Aintree Rd
- 1724 Waverly Cir
- 1304 Hawkins Ct
- 55 Whittington Course
- 1919 Waverly Cir
- 820 Derby Course
- 902 Derby Course
- Lot 4 Mosedale St
- 740 Courtyard Dr
- 2450 Persimmon Dr
- 3409 Blackhawk Trail
- 3041 Majestic Oaks Ln Unit 2
- 1101 King Edward Ave
- 272 Charlestowne Lake Dr
- 352 Bridgeview Ct
- lot 012 Tuscola Ave
- 3001 Glen Eagles Ct
- 274 Charlestowne Lake Dr
- 274 Charlestowne Lakes Dr
- 11 Highgate Course
- 81 Highgate Course
- 17 Highgate Course
- 4 Highgate Ct
- 77 Highgate Course
- 2 Highgate Course
- 77 Highgate Course
- 134 Highgate Course
- 8 Highgate Ct
- 6 Highgate Course
- 21 Highgate Course
- 130 Highgate Course
- 14 Highgate Course
- 18 Highgate Course
- 73 Highgate Course
- 18 Highgate Course
- 126 Highgate Course
- 22 Highgate Course
- 26 Highgate Course
Your Personal Tour Guide
Ask me questions while you tour the home.