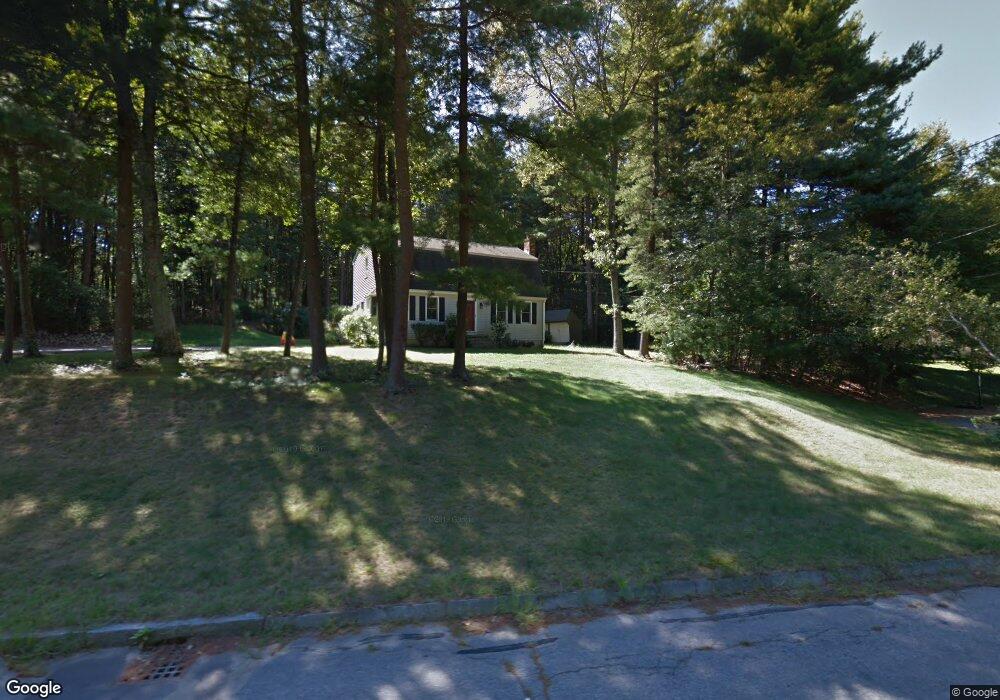
9 Julie Dawn Dr Franklin, MA 02038
Estimated Value: $692,000 - $786,000
3
Beds
2
Baths
1,685
Sq Ft
$440/Sq Ft
Est. Value
About This Home
This home is located at 9 Julie Dawn Dr, Franklin, MA 02038 and is currently estimated at $740,974, approximately $439 per square foot. 9 Julie Dawn Dr is a home located in Norfolk County with nearby schools including Helen Keller Elementary School, Annie Sullivan Middle School, and Franklin High School.
Ownership History
Date
Name
Owned For
Owner Type
Purchase Details
Closed on
Aug 4, 2020
Sold by
Carmine Jonathan W and Carmine Sarah E
Bought by
Carmine Jonathan W and Driscoll Margaret
Current Estimated Value
Home Financials for this Owner
Home Financials are based on the most recent Mortgage that was taken out on this home.
Original Mortgage
$348,000
Outstanding Balance
$306,715
Interest Rate
2.9%
Mortgage Type
New Conventional
Estimated Equity
$434,259
Purchase Details
Closed on
Oct 14, 2011
Sold by
Zimmermann David A and Zimmermann Patricia A
Bought by
Carmine Jonathan W and Carmine Sarah E
Home Financials for this Owner
Home Financials are based on the most recent Mortgage that was taken out on this home.
Original Mortgage
$321,100
Interest Rate
4.25%
Mortgage Type
Purchase Money Mortgage
Create a Home Valuation Report for This Property
The Home Valuation Report is an in-depth analysis detailing your home's value as well as a comparison with similar homes in the area
Home Values in the Area
Average Home Value in this Area
Purchase History
| Date | Buyer | Sale Price | Title Company |
|---|---|---|---|
| Carmine Jonathan W | -- | None Available | |
| Carmine Jonathan W | $338,000 | -- | |
| Carmine Jonathan W | $338,000 | -- |
Source: Public Records
Mortgage History
| Date | Status | Borrower | Loan Amount |
|---|---|---|---|
| Open | Carmine Jonathan W | $348,000 | |
| Previous Owner | Carmine Jonathan W | $321,100 | |
| Previous Owner | Carmine Jonathan W | $86,000 |
Source: Public Records
Tax History Compared to Growth
Tax History
| Year | Tax Paid | Tax Assessment Tax Assessment Total Assessment is a certain percentage of the fair market value that is determined by local assessors to be the total taxable value of land and additions on the property. | Land | Improvement |
|---|---|---|---|---|
| 2025 | $7,488 | $644,400 | $365,800 | $278,600 |
| 2024 | $7,477 | $634,200 | $365,800 | $268,400 |
| 2023 | $7,138 | $567,400 | $311,700 | $255,700 |
| 2022 | $6,620 | $471,200 | $245,500 | $225,700 |
| 2021 | $6,694 | $456,900 | $275,800 | $181,100 |
| 2020 | $6,337 | $436,700 | $264,400 | $172,300 |
| 2019 | $6,236 | $425,400 | $253,200 | $172,200 |
| 2018 | $5,842 | $398,800 | $244,100 | $154,700 |
| 2017 | $5,551 | $380,700 | $226,000 | $154,700 |
| 2016 | $5,461 | $376,600 | $240,800 | $135,800 |
| 2015 | $5,411 | $364,600 | $228,800 | $135,800 |
| 2014 | $4,862 | $336,500 | $200,700 | $135,800 |
Source: Public Records
Map
Nearby Homes
- 33 Daniels St
- 70 Daniels St
- 10 Silver Fox Rd
- 99 Leland Rd
- 312 Eagles Nest Way Unit 312
- 10 Populatic Street Extension
- 41 Myrtle St
- 12 Ariana Ln
- 48 Leanne Way Unit 48
- 91 Oliver Pond Cir Unit 3
- 83 Oliver Pond Cir Unit 7
- 24 Shayne Rd Unit 219
- 98 Myrtle St
- 732 Lincoln St
- 0 Toils End Rd
- 324 Pleasant St
- 48 River Rd
- 2 Skyline Dr
- 204 Lincoln St
- 56 Fuller Place
- 11 Julie Dawn Dr
- 7 Julie Dawn Dr
- 8 Julie Dawn Dr
- 6 Julie Dawn Dr
- 5 Julie Dawn Dr
- 16 Homes Ave
- 4 Julie Dawn Dr
- 15 Winding Brook Rd
- 3 Julie Dawn Dr
- 114 Miller St
- 6 Denise Dr
- 10 Briarwood Rd
- 110 Miller St
- 11 Winding Brook Rd
- 8 Briarwood Rd
- 4 Denise Dr
- 1 Julie Dawn Dr
- 118 Miller St
- 6 Briarwood Rd
- 5 Denise Dr