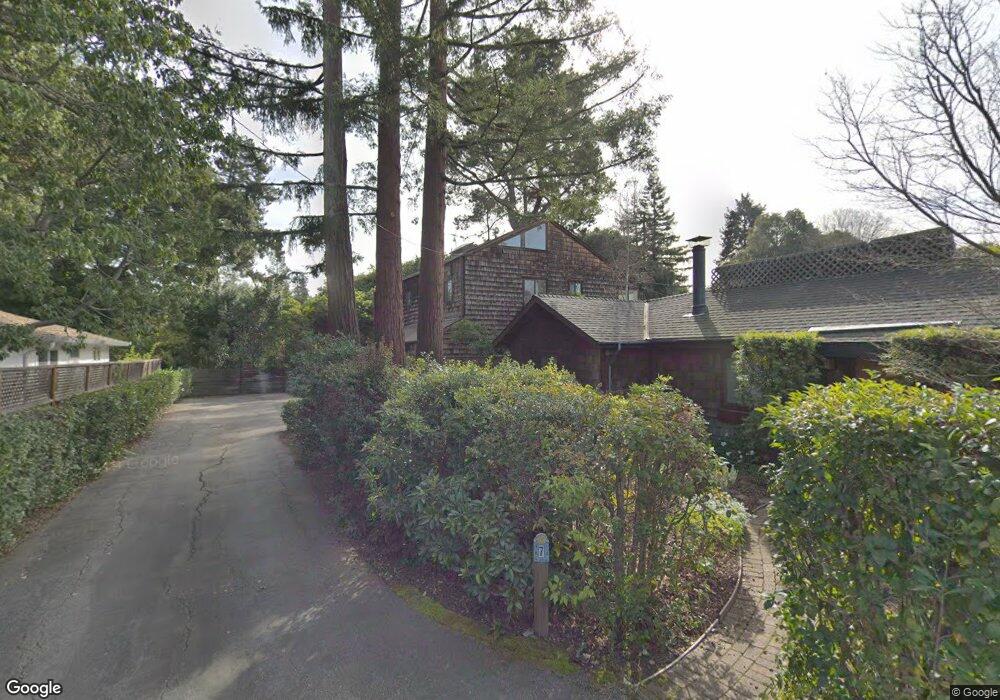
9 Light Way Menlo Park, CA 94025
North Fair Oaks NeighborhoodEstimated Value: $2,130,000 - $2,798,000
3
Beds
3
Baths
2,370
Sq Ft
$1,067/Sq Ft
Est. Value
About This Home
This home is located at 9 Light Way, Menlo Park, CA 94025 and is currently estimated at $2,529,155, approximately $1,067 per square foot. 9 Light Way is a home located in San Mateo County with nearby schools including Garfield Elementary School, John F. Kennedy Middle School, and Menlo-Atherton High School.
Ownership History
Date
Name
Owned For
Owner Type
Purchase Details
Closed on
Apr 2, 2018
Sold by
Hagadorn Hubert W
Bought by
The Hubert W Hagadorn Living Trust
Current Estimated Value
Purchase Details
Closed on
Oct 9, 1995
Sold by
Hagadorn Hubert
Bought by
Hagadorn Hubert W
Home Financials for this Owner
Home Financials are based on the most recent Mortgage that was taken out on this home.
Original Mortgage
$175,000
Interest Rate
7.59%
Create a Home Valuation Report for This Property
The Home Valuation Report is an in-depth analysis detailing your home's value as well as a comparison with similar homes in the area
Home Values in the Area
Average Home Value in this Area
Purchase History
| Date | Buyer | Sale Price | Title Company |
|---|---|---|---|
| The Hubert W Hagadorn Living Trust | -- | None Available | |
| Hagadorn Hubert W | -- | Fidelity National Title Ins |
Source: Public Records
Mortgage History
| Date | Status | Borrower | Loan Amount |
|---|---|---|---|
| Closed | Hagadorn Hubert W | $175,000 |
Source: Public Records
Tax History
| Year | Tax Paid | Tax Assessment Tax Assessment Total Assessment is a certain percentage of the fair market value that is determined by local assessors to be the total taxable value of land and additions on the property. | Land | Improvement |
|---|---|---|---|---|
| 2025 | $6,665 | $464,886 | $151,644 | $313,242 |
| 2023 | $6,665 | $446,835 | $145,756 | $301,079 |
| 2022 | $6,211 | $438,075 | $142,899 | $295,176 |
| 2021 | $6,133 | $429,487 | $140,098 | $289,389 |
| 2020 | $6,040 | $425,084 | $138,662 | $286,422 |
| 2019 | $5,960 | $416,750 | $135,944 | $280,806 |
| 2018 | $5,735 | $408,579 | $133,279 | $275,300 |
| 2017 | $5,497 | $400,568 | $130,666 | $269,902 |
| 2016 | $5,329 | $392,714 | $128,104 | $264,610 |
| 2015 | $5,128 | $386,816 | $126,180 | $260,636 |
| 2014 | $5,017 | $379,240 | $123,709 | $255,531 |
Source: Public Records
Map
Nearby Homes
Your Personal Tour Guide
Ask me questions while you tour the home.