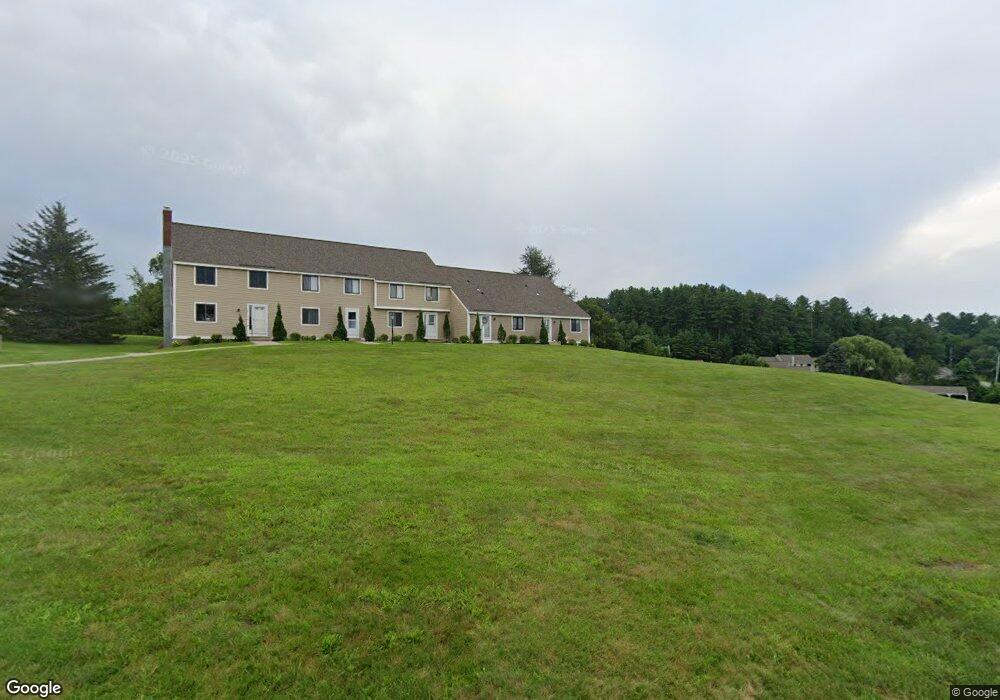
9 Pendleton Ln Unit 9 Londonderry, NH 03053
Estimated Value: $293,000 - $366,000
2
Beds
3
Baths
2,020
Sq Ft
$161/Sq Ft
Est. Value
About This Home
This home is located at 9 Pendleton Ln Unit 9, Londonderry, NH 03053 and is currently estimated at $326,061, approximately $161 per square foot. 9 Pendleton Ln Unit 9 is a home located in Rockingham County with nearby schools including South Londonderry Elementary School, Londonderry Middle School, and Londonderry Senior High School.
Ownership History
Date
Name
Owned For
Owner Type
Purchase Details
Closed on
Nov 21, 2018
Sold by
Mg Holdings Llc
Bought by
Hager Joan
Current Estimated Value
Home Financials for this Owner
Home Financials are based on the most recent Mortgage that was taken out on this home.
Original Mortgage
$151,050
Outstanding Balance
$132,047
Interest Rate
4.9%
Mortgage Type
New Conventional
Estimated Equity
$194,014
Purchase Details
Closed on
Jun 1, 2011
Sold by
117 Millville Circle L
Bought by
Houston Daniel P and Houston Sarah M
Home Financials for this Owner
Home Financials are based on the most recent Mortgage that was taken out on this home.
Original Mortgage
$142,298
Interest Rate
4.85%
Mortgage Type
Purchase Money Mortgage
Purchase Details
Closed on
Jun 3, 2010
Sold by
Yazel Jonathan M and Us Bank Na
Bought by
Fhlmc
Create a Home Valuation Report for This Property
The Home Valuation Report is an in-depth analysis detailing your home's value as well as a comparison with similar homes in the area
Home Values in the Area
Average Home Value in this Area
Purchase History
| Date | Buyer | Sale Price | Title Company |
|---|---|---|---|
| Hager Joan | $159,000 | -- | |
| Houston Daniel P | $146,000 | -- | |
| Fhlmc | $153,500 | -- |
Source: Public Records
Mortgage History
| Date | Status | Borrower | Loan Amount |
|---|---|---|---|
| Open | Hager Joan | $151,050 | |
| Previous Owner | Fhlmc | $142,298 |
Source: Public Records
Tax History
| Year | Tax Paid | Tax Assessment Tax Assessment Total Assessment is a certain percentage of the fair market value that is determined by local assessors to be the total taxable value of land and additions on the property. | Land | Improvement |
|---|---|---|---|---|
| 2025 | $4,485 | $277,900 | $0 | $277,900 |
| 2024 | $4,485 | $277,900 | $0 | $277,900 |
| 2023 | $4,349 | $277,900 | $0 | $277,900 |
| 2022 | $3,639 | $196,900 | $0 | $196,900 |
| 2021 | $3,619 | $196,900 | $0 | $196,900 |
| 2020 | $4,336 | $215,600 | $0 | $215,600 |
| 2019 | $4,180 | $215,600 | $0 | $215,600 |
| 2018 | $4,242 | $194,600 | $0 | $194,600 |
| 2017 | $4,205 | $194,600 | $0 | $194,600 |
| 2016 | $4,089 | $190,200 | $0 | $190,200 |
| 2015 | $3,998 | $190,200 | $0 | $190,200 |
| 2014 | $4,011 | $190,200 | $0 | $190,200 |
| 2011 | -- | $199,500 | $0 | $199,500 |
Source: Public Records
Map
Nearby Homes
- 145 Canterbury Ln
- 5 Delphi Way
- 7 Delphi Way
- 19 Lily Ln
- 67B Kienia Rd
- 17 Lily Ln
- 35 Olde Country Village Rd Unit 35
- 4 Windsor Blvd
- 16 Brady Dr
- 5 Rainbow Dr
- 15 Brady Dr
- 4 Sunset Dr Unit A
- 62 Elwood Rd
- 8 Wiley Hill Rd
- 6 Finch Cir
- 90 High Range Rd
- 128 Sandstone Cir
- 15A David Dr
- 33 Griffin Rd
- 3 Acadia Dr Unit 2-7
- 9 Pendleton Ln
- 11 Pendleton Ln
- 12 Pendleton Ln
- 14 Pendleton Ln
- 8 Pendleton Ln
- 8 Pendleton Ln Unit 8
- 7 Pendleton Ln
- 5 Pendleton Ln
- 28 Pendleton Ln
- 28 Pendleton Ln Unit 28
- 15 Pendleton Ln
- 15 Pendleton Ln Unit 15
- 26 Pendleton Ln
- 26 Pendleton Ln Unit 26
- 16 Pendleton Ln
- 18 Pendleton Ln
- 18 Pendleton Ln Unit 18
- 120 Treadway Ln Unit 120
- 123 Treadway Ln Unit 123
- 124 Treadway Ln Unit 124
Your Personal Tour Guide
Ask me questions while you tour the home.