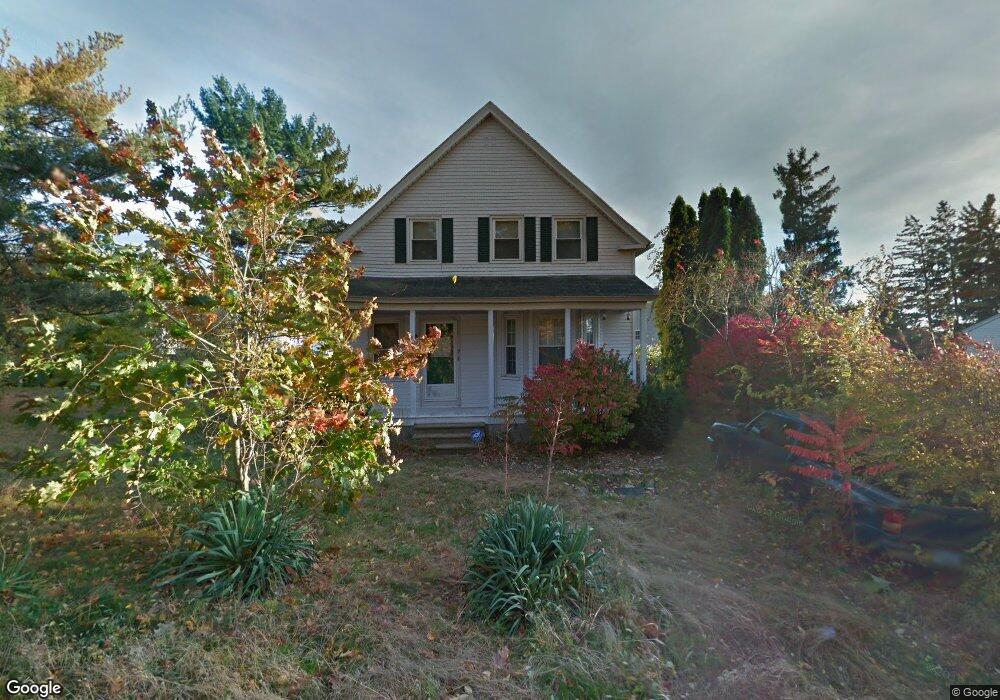
9 Roycroft Rd Worcester, MA 01606
Greendale NeighborhoodEstimated Value: $423,000 - $462,000
3
Beds
1
Bath
1,249
Sq Ft
$349/Sq Ft
Est. Value
About This Home
This home is located at 9 Roycroft Rd, Worcester, MA 01606 and is currently estimated at $435,496, approximately $348 per square foot. 9 Roycroft Rd is a home located in Worcester County with nearby schools including Belmont Street Community School, Jacob Hiatt Magnet School, and Chandler Magnet.
Ownership History
Date
Name
Owned For
Owner Type
Purchase Details
Closed on
Nov 4, 2024
Sold by
Smith Theresa M and Julian Roland E
Bought by
Smith Theresa M and Julian Roland E
Current Estimated Value
Home Financials for this Owner
Home Financials are based on the most recent Mortgage that was taken out on this home.
Original Mortgage
$303,350
Outstanding Balance
$298,407
Interest Rate
6.08%
Mortgage Type
New Conventional
Estimated Equity
$137,089
Purchase Details
Closed on
Aug 18, 2017
Sold by
Mcbride Erika
Bought by
Smith Theresa and Julian Roland E
Home Financials for this Owner
Home Financials are based on the most recent Mortgage that was taken out on this home.
Original Mortgage
$196,377
Interest Rate
3.96%
Mortgage Type
FHA
Purchase Details
Closed on
Aug 12, 2005
Sold by
Williams Elizabeth R and Williams Mark A
Bought by
Mcbride Erika D
Purchase Details
Closed on
Sep 26, 2000
Sold by
Benoit Gertrude Ellen
Bought by
Williams Elizabeth R and Williams Mark A
Create a Home Valuation Report for This Property
The Home Valuation Report is an in-depth analysis detailing your home's value as well as a comparison with similar homes in the area
Home Values in the Area
Average Home Value in this Area
Purchase History
| Date | Buyer | Sale Price | Title Company |
|---|---|---|---|
| Smith Theresa M | -- | None Available | |
| Smith Theresa M | -- | None Available | |
| Smith Theresa M | -- | None Available | |
| Smith Theresa M | -- | None Available | |
| Smith Theresa | $200,000 | -- | |
| Smith Theresa | $200,000 | -- | |
| Mcbride Erika D | $236,000 | -- | |
| Mcbride Erika D | $236,000 | -- | |
| Williams Elizabeth R | $131,250 | -- | |
| Williams Elizabeth R | $131,250 | -- | |
| Mcbride Erika D | $236,000 | -- | |
| Williams Elizabeth R | $131,250 | -- | |
| Mcbride Erika D | $236,000 | -- | |
| Williams Elizabeth R | $131,250 | -- |
Source: Public Records
Mortgage History
| Date | Status | Borrower | Loan Amount |
|---|---|---|---|
| Open | Smith Theresa M | $303,350 | |
| Closed | Smith Theresa M | $303,350 | |
| Previous Owner | Smith Theresa | $196,377 |
Source: Public Records
Tax History
| Year | Tax Paid | Tax Assessment Tax Assessment Total Assessment is a certain percentage of the fair market value that is determined by local assessors to be the total taxable value of land and additions on the property. | Land | Improvement |
|---|---|---|---|---|
| 2025 | $4,771 | $361,700 | $118,300 | $243,400 |
| 2024 | $4,591 | $333,900 | $118,300 | $215,600 |
| 2023 | $4,404 | $307,100 | $102,900 | $204,200 |
| 2022 | $3,904 | $256,700 | $82,300 | $174,400 |
| 2021 | $3,696 | $227,000 | $65,900 | $161,100 |
| 2020 | $3,538 | $208,100 | $65,900 | $142,200 |
| 2019 | $3,400 | $188,900 | $59,300 | $129,600 |
| 2018 | $3,046 | $161,100 | $53,300 | $107,800 |
| 2017 | $2,929 | $152,400 | $53,300 | $99,100 |
| 2016 | $2,865 | $139,000 | $39,000 | $100,000 |
| 2015 | $2,790 | $139,000 | $39,000 | $100,000 |
| 2014 | $2,800 | $143,300 | $43,300 | $100,000 |
Source: Public Records
Map
Nearby Homes
- 93 Blue Bell Rd
- 30 Danielles Way
- 18 Danielles Way
- 53 Mount Ave
- 1 Triangle St
- 4 Winston Rd
- 10 Malden St
- 328 Brooks St
- 63 Airlie St
- 331 Burncoat St
- 36 Sunrise Ave
- 19 Rowena St
- 101 Ararat St
- 94 Kendrick Ave
- 169 Whitmarsh Ave
- 96 Uncatena Ave
- 63 Cobblestone Ln Unit 63
- 31 Enaya Cir Unit 31
- 216 W Mountain St
- 18 Hillcroft Ave
- 9 Roycroft Rd Unit 11
- 13 Marland Rd
- 13 Marland Rd Unit 2
- 13 Marland Rd Unit 3
- 7 Roycroft Rd Unit 5
- 7 Roycroft Rd Unit 2
- 7 Roycroft Rd Unit 7
- 7 Roycroft Rd Unit 6
- 7 Roycroft Rd Unit 4
- 7 Roycroft Rd Unit 8
- 7 Roycroft Rd
- 2 Naples Rd
- 11 Marland Rd
- 19 Marland Rd
- 3 Naples Rd
- ONE Naples Rd
- 1 Naples Rd
- 21 Marland Rd
- 7 Marland Rd
- 5 Roland Rd
Your Personal Tour Guide
Ask me questions while you tour the home.