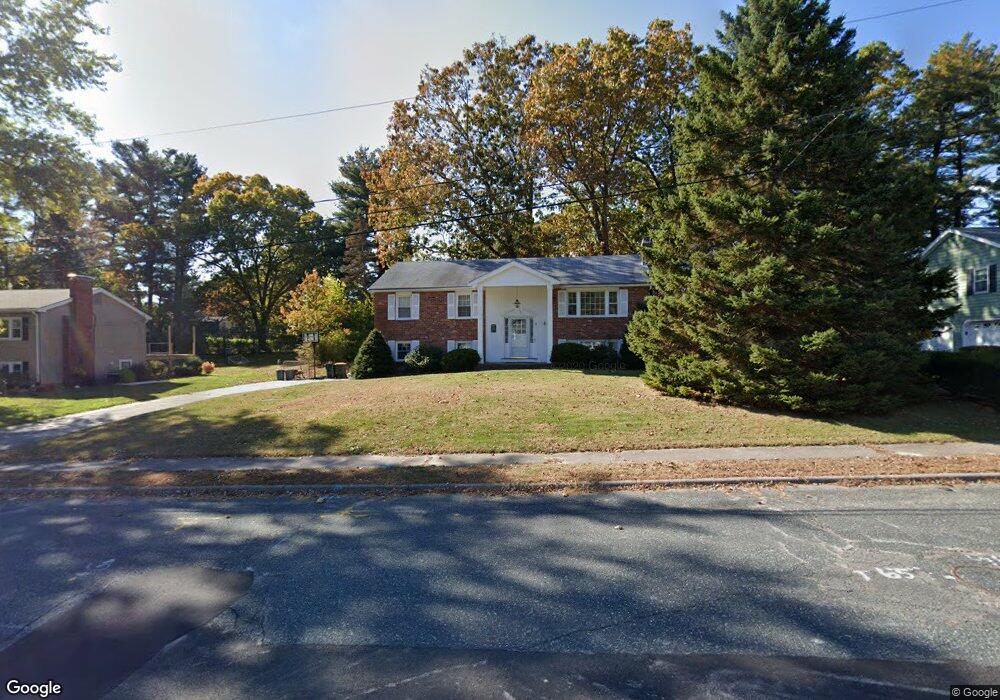
9 Stanford Rd Franklin, MA 02038
Wadsworth NeighborhoodEstimated Value: $592,000 - $754,000
3
Beds
2
Baths
1,170
Sq Ft
$558/Sq Ft
Est. Value
About This Home
This home is located at 9 Stanford Rd, Franklin, MA 02038 and is currently estimated at $653,140, approximately $558 per square foot. 9 Stanford Rd is a home located in Norfolk County with nearby schools including Jefferson Elementary School, Remington Middle School, and Franklin High School.
Ownership History
Date
Name
Owned For
Owner Type
Purchase Details
Closed on
Aug 26, 2022
Sold by
Nutter Benjamin R and Nutter Jessica M
Bought by
B R Nutter 2022 Ret
Current Estimated Value
Purchase Details
Closed on
May 4, 2009
Sold by
Goodwin Evelyn I
Bought by
Nutter Benjamin and Nutter Jessica
Home Financials for this Owner
Home Financials are based on the most recent Mortgage that was taken out on this home.
Original Mortgage
$259,461
Interest Rate
4.86%
Mortgage Type
VA
Purchase Details
Closed on
May 15, 2006
Sold by
Roslan Henry F and Goodwin Robert A
Bought by
Goodwin Evelyn I
Create a Home Valuation Report for This Property
The Home Valuation Report is an in-depth analysis detailing your home's value as well as a comparison with similar homes in the area
Home Values in the Area
Average Home Value in this Area
Purchase History
| Date | Buyer | Sale Price | Title Company |
|---|---|---|---|
| B R Nutter 2022 Ret | -- | None Available | |
| Nutter Benjamin | $254,000 | -- | |
| Goodwin Evelyn I | -- | -- |
Source: Public Records
Mortgage History
| Date | Status | Borrower | Loan Amount |
|---|---|---|---|
| Previous Owner | Nutter Benjamin | $259,461 |
Source: Public Records
Tax History Compared to Growth
Tax History
| Year | Tax Paid | Tax Assessment Tax Assessment Total Assessment is a certain percentage of the fair market value that is determined by local assessors to be the total taxable value of land and additions on the property. | Land | Improvement |
|---|---|---|---|---|
| 2025 | $6,426 | $553,000 | $242,500 | $310,500 |
| 2024 | $6,151 | $521,700 | $242,500 | $279,200 |
| 2023 | $5,992 | $476,300 | $253,000 | $223,300 |
| 2022 | $5,713 | $406,600 | $209,100 | $197,500 |
| 2021 | $5,230 | $357,000 | $205,000 | $152,000 |
| 2020 | $5,296 | $365,000 | $220,300 | $144,700 |
| 2019 | $5,042 | $343,900 | $199,300 | $144,600 |
| 2018 | $4,965 | $338,900 | $208,800 | $130,100 |
| 2017 | $4,690 | $321,700 | $191,600 | $130,100 |
| 2016 | $4,578 | $315,700 | $204,500 | $111,200 |
| 2015 | $4,330 | $291,800 | $180,600 | $111,200 |
| 2014 | $4,069 | $281,600 | $170,400 | $111,200 |
Source: Public Records
Map
Nearby Homes
- 10 Stanford Rd
- 17 Stanford Rd
- 584 Washington St
- 851 Washington St
- 8 Bubbling Brook Rd
- 732 King St
- 246 Washington St
- 236 Williams St
- 0 Prospect St
- 50 Wamsutta Way
- 2095 West St
- 16 Danforth Way
- 417 Union St
- 1 Joy St
- 151 Stone Ridge Rd
- 352 Lake St
- 374-378 Union St
- 2 Duhamel Way
- 109 Stone Ridge Rd Unit 109
- 1 Pond Place