9 Upland Cir Mashpee, MA 02649
Estimated Value: $499,000 - $746,000
2
Beds
2
Baths
2,000
Sq Ft
$304/Sq Ft
Est. Value
About This Home
This home is located at 9 Upland Cir, Mashpee, MA 02649 and is currently estimated at $608,764, approximately $304 per square foot. 9 Upland Cir is a home located in Barnstable County with nearby schools including Kenneth C. Coombs School, Quashnet School, and Mashpee Middle School.
Ownership History
Date
Name
Owned For
Owner Type
Purchase Details
Closed on
Feb 14, 2006
Sold by
Kaeppeler Arnold D and Kaeppeler Karen M
Bought by
Kaeppeler Arnold D
Current Estimated Value
Home Financials for this Owner
Home Financials are based on the most recent Mortgage that was taken out on this home.
Original Mortgage
$280,000
Outstanding Balance
$156,848
Interest Rate
6.31%
Estimated Equity
$451,916
Purchase Details
Closed on
Feb 3, 2006
Sold by
Raposa Angelina A and Raposa Frank L
Bought by
Kaeppeler Arnold D
Home Financials for this Owner
Home Financials are based on the most recent Mortgage that was taken out on this home.
Original Mortgage
$280,000
Outstanding Balance
$156,848
Interest Rate
6.31%
Estimated Equity
$451,916
Purchase Details
Closed on
Jul 10, 2000
Sold by
Cape Southport Assocs
Bought by
Raposa Frank L
Home Financials for this Owner
Home Financials are based on the most recent Mortgage that was taken out on this home.
Original Mortgage
$100,000
Interest Rate
8.55%
Mortgage Type
Purchase Money Mortgage
Create a Home Valuation Report for This Property
The Home Valuation Report is an in-depth analysis detailing your home's value as well as a comparison with similar homes in the area
Purchase History
| Date | Buyer | Sale Price | Title Company |
|---|---|---|---|
| Kaeppeler Arnold D | -- | -- | |
| Kaeppeler Arnold D | -- | -- | |
| Kaeppeler Arnold D | $392,500 | -- | |
| Raposa Frank L | $212,400 | -- |
Source: Public Records
Mortgage History
| Date | Status | Borrower | Loan Amount |
|---|---|---|---|
| Open | Kaeppeler Arnold D | $280,000 | |
| Previous Owner | Raposa Frank L | $100,000 |
Source: Public Records
Tax History
| Year | Tax Paid | Tax Assessment Tax Assessment Total Assessment is a certain percentage of the fair market value that is determined by local assessors to be the total taxable value of land and additions on the property. | Land | Improvement |
|---|---|---|---|---|
| 2025 | $3,942 | $595,500 | $0 | $595,500 |
| 2024 | $3,765 | $585,600 | $0 | $585,600 |
| 2023 | $3,639 | $519,100 | $0 | $519,100 |
| 2022 | $3,605 | $441,200 | $0 | $441,200 |
| 2021 | $3,775 | $416,200 | $0 | $416,200 |
| 2020 | $3,694 | $406,400 | $0 | $406,400 |
| 2019 | $3,577 | $395,200 | $0 | $395,200 |
| 2018 | $3,334 | $373,800 | $0 | $373,800 |
| 2017 | $3,337 | $363,100 | $0 | $363,100 |
| 2016 | $3,264 | $353,200 | $0 | $353,200 |
| 2015 | $2,853 | $313,200 | $0 | $313,200 |
| 2014 | $2,984 | $317,800 | $0 | $317,800 |
Source: Public Records
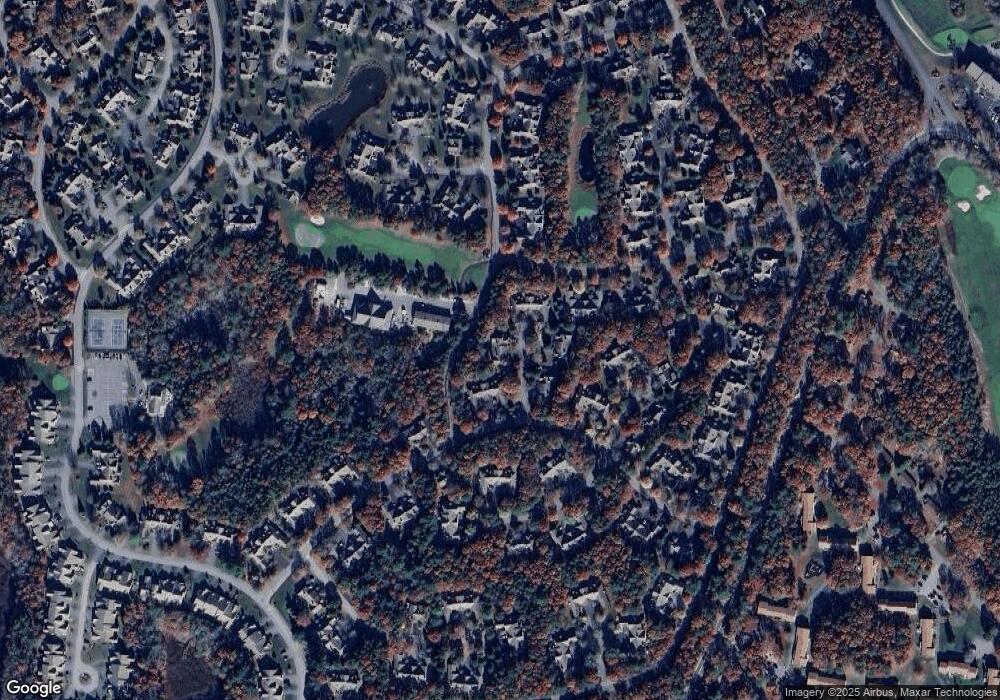
Map
Nearby Homes
- 1 Upland Cir
- 1 Upland Cir Unit 1
- 18 Windward St Unit 18
- 18 Executive Dr Unit 18
- 80 Pine Hill Blvd Unit 80
- 5 Kettle Ln Unit 38
- 50 Pine Hill Blvd Unit 46
- 50 Pine Hill Blvd
- 10 Kettle Ln
- 153 Leisure Green Dr
- 153 Leisure Green Dr Unit 749
- 1 Masters Ct
- 6 Masters Ct
- 15 Pebble Beach Ave Unit 2005-103
- 15 Pebble Beach Ave
- 4 N Ridge Rd
- 4 N Ridge Rd Unit 431
- 8 Chippers Ln
- 8 Chippers Ln Unit 390
- 22 Country Club Ln
- 10 Upland Cir
- 10 Upland Cir Unit 10
- 32 Portside Dr
- 34 Portside Dr
- 36 Portside Dr
- 38 Portside Dr
- 32 Portside Dr Unit 111
- 7 Upland Cir Unit 104
- 8 Upland Cir
- 7 Upland Cir
- 6 Upland Cir
- 5 Upland Cir
- 7 Upland Cr Cir
- 5 Upland Cir Unit 102
- 8 Upland Cir Unit 105
- 6 Upland Cir Unit 103
- 8 Upland Cir Unit 8
- 2 Upland Cir
- 4 Upland Cir
- 3 Upland Cir
Your Personal Tour Guide
Ask me questions while you tour the home.