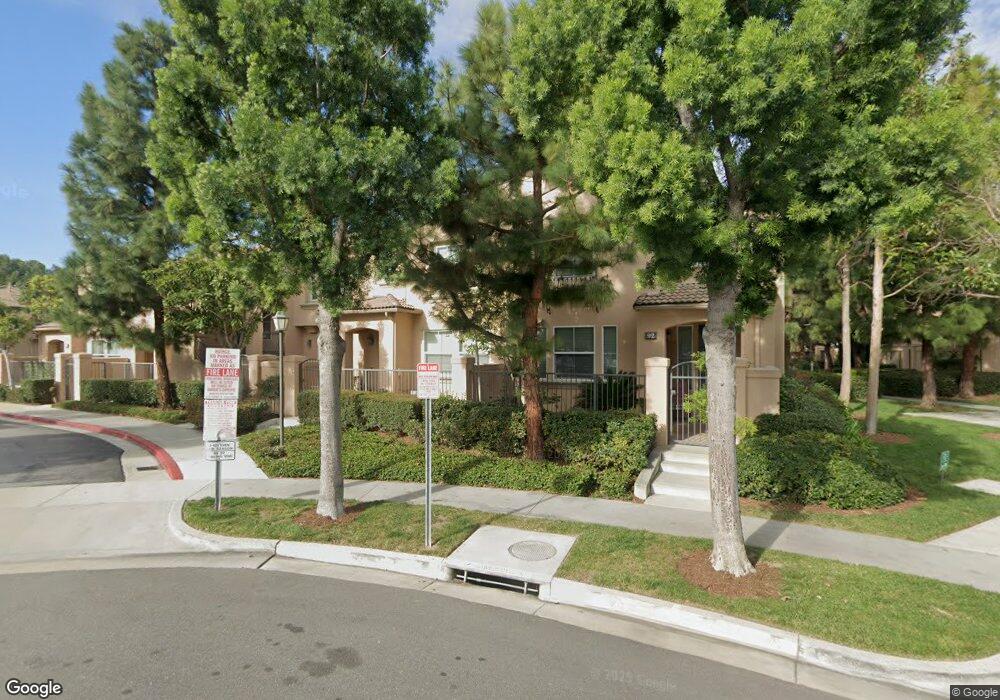
90 Trailing Vine Unit 90 Irvine, CA 92602
Lower Peters Canyon NeighborhoodEstimated Value: $1,098,441 - $1,179,000
3
Beds
2
Baths
1,346
Sq Ft
$845/Sq Ft
Est. Value
About This Home
This home is located at 90 Trailing Vine Unit 90, Irvine, CA 92602 and is currently estimated at $1,136,860, approximately $844 per square foot. 90 Trailing Vine Unit 90 is a home located in Orange County with nearby schools including Hicks Canyon Elementary School, Orchard Hills School, and Arnold O. Beckman High School.
Ownership History
Date
Name
Owned For
Owner Type
Purchase Details
Closed on
Feb 13, 2019
Sold by
Tokar Marga A and Tokar Marga A
Bought by
Tokar Marga A
Current Estimated Value
Home Financials for this Owner
Home Financials are based on the most recent Mortgage that was taken out on this home.
Original Mortgage
$422,500
Outstanding Balance
$370,696
Interest Rate
4.4%
Mortgage Type
New Conventional
Estimated Equity
$766,164
Purchase Details
Closed on
Feb 20, 2018
Sold by
Gandara Mario
Bought by
Tokar Marga A
Purchase Details
Closed on
Sep 16, 2005
Sold by
William Lyon Homes Inc
Bought by
Gandara Mario and Tokar Marga A
Home Financials for this Owner
Home Financials are based on the most recent Mortgage that was taken out on this home.
Original Mortgage
$78,650
Interest Rate
5.74%
Mortgage Type
Purchase Money Mortgage
Create a Home Valuation Report for This Property
The Home Valuation Report is an in-depth analysis detailing your home's value as well as a comparison with similar homes in the area
Home Values in the Area
Average Home Value in this Area
Purchase History
| Date | Buyer | Sale Price | Title Company |
|---|---|---|---|
| Tokar Marga A | -- | Servicelink | |
| Tokar Marga A | -- | None Available | |
| Gandara Mario | $524,500 | Fidelity National Title-Buil |
Source: Public Records
Mortgage History
| Date | Status | Borrower | Loan Amount |
|---|---|---|---|
| Open | Tokar Marga A | $422,500 | |
| Previous Owner | Gandara Mario | $78,650 |
Source: Public Records
Tax History
| Year | Tax Paid | Tax Assessment Tax Assessment Total Assessment is a certain percentage of the fair market value that is determined by local assessors to be the total taxable value of land and additions on the property. | Land | Improvement |
|---|---|---|---|---|
| 2025 | $7,853 | $716,492 | $467,652 | $248,840 |
| 2024 | $7,853 | $702,444 | $458,483 | $243,961 |
| 2023 | $7,700 | $688,671 | $449,493 | $239,178 |
| 2022 | $7,046 | $626,280 | $419,225 | $207,055 |
| 2021 | $7,824 | $614,000 | $411,004 | $202,996 |
| 2020 | $7,819 | $614,000 | $411,004 | $202,996 |
| 2019 | $7,796 | $614,000 | $411,004 | $202,996 |
| 2018 | $7,773 | $614,000 | $411,004 | $202,996 |
| 2017 | $7,117 | $555,000 | $369,263 | $185,737 |
| 2016 | $6,764 | $521,700 | $335,963 | $185,737 |
| 2015 | $6,696 | $521,700 | $335,963 | $185,737 |
| 2014 | $6,692 | $521,700 | $335,963 | $185,737 |
Source: Public Records
Map
Nearby Homes
- 72 Trailing Vine
- 76 Trailing Vine Unit 97
- 76 Trailing Vine
- 88 Trailing Vine
- 78 Trailing Vine
- 66 Trailing Vine
- 62 Trailing Vine
- 86 Trailing Vine
- 60 Trailing Vine
- 92 Trailing Vine
- 84 Trailing Vine Unit 93
- 56 Trailing Vine
- 52 Trailing Vine Unit 109
- 50 Trailing Vine Unit 110
- 48 Trailing Vine Unit 111
- 46 Trailing Vine Unit 112
- 38 Trailing Vine
- 36 Trailing Vine
- 34 Trailing Vine Unit 23
- 98 New Season Unit 73
Your Personal Tour Guide
Ask me questions while you tour the home.