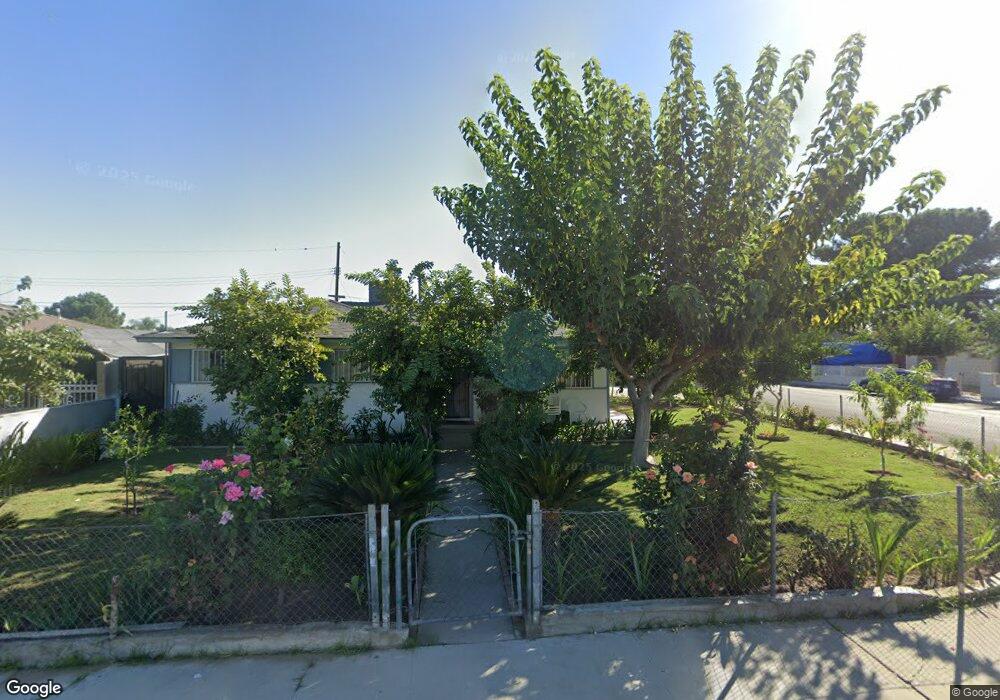
902 Belmont St Delano, CA 93215
West Delano NeighborhoodEstimated Value: $166,000 - $267,000
3
Beds
1
Bath
1,017
Sq Ft
$228/Sq Ft
Est. Value
About This Home
This home is located at 902 Belmont St, Delano, CA 93215 and is currently estimated at $231,949, approximately $228 per square foot. 902 Belmont St is a home located in Kern County with nearby schools including Fremont Elementary School, Almond Tree Middle School, and Robert F. Kennedy High School.
Ownership History
Date
Name
Owned For
Owner Type
Purchase Details
Closed on
Oct 8, 2024
Sold by
Medina Norma A
Bought by
Jeronimo Jaime Rosales and Hernandez Paula Erika
Current Estimated Value
Home Financials for this Owner
Home Financials are based on the most recent Mortgage that was taken out on this home.
Original Mortgage
$166,920
Outstanding Balance
$165,087
Interest Rate
6.12%
Mortgage Type
FHA
Estimated Equity
$66,862
Purchase Details
Closed on
Oct 8, 2020
Sold by
Jeronimo Ugo Rosales
Bought by
Medina Norma A
Purchase Details
Closed on
Nov 13, 2014
Sold by
Rosales Lucina J
Bought by
Jeronimo Ugo Rosales
Purchase Details
Closed on
Feb 17, 1999
Sold by
Rosales Bernardino C and Rosales Lucina J
Bought by
Rosales Bernardino C and Rosales Lucina J
Home Financials for this Owner
Home Financials are based on the most recent Mortgage that was taken out on this home.
Original Mortgage
$40,000
Interest Rate
6.7%
Create a Home Valuation Report for This Property
The Home Valuation Report is an in-depth analysis detailing your home's value as well as a comparison with similar homes in the area
Home Values in the Area
Average Home Value in this Area
Purchase History
| Date | Buyer | Sale Price | Title Company |
|---|---|---|---|
| Jeronimo Jaime Rosales | $170,000 | Placer Title | |
| Rosales Jeronimo Jaime | $170,000 | Placer Title | |
| Medina Norma A | -- | None Available | |
| Jeronimo Ugo Rosales | -- | None Available | |
| Rosales Bernardino C | $20,000 | Stewart Title |
Source: Public Records
Mortgage History
| Date | Status | Borrower | Loan Amount |
|---|---|---|---|
| Open | Rosales Jeronimo Jaime | $166,920 | |
| Closed | Jeronimo Jaime Rosales | $166,920 | |
| Previous Owner | Rosales Bernardino C | $40,000 |
Source: Public Records
Tax History
| Year | Tax Paid | Tax Assessment Tax Assessment Total Assessment is a certain percentage of the fair market value that is determined by local assessors to be the total taxable value of land and additions on the property. | Land | Improvement |
|---|---|---|---|---|
| 2025 | $2,073 | $170,000 | $50,000 | $120,000 |
| 2024 | $2,015 | $169,792 | $42,448 | $127,344 |
| 2023 | $2,015 | $166,464 | $41,616 | $124,848 |
| 2022 | $1,982 | $163,200 | $40,800 | $122,400 |
| 2021 | $1,909 | $160,000 | $40,000 | $120,000 |
| 2020 | $1,587 | $137,361 | $32,966 | $104,395 |
| 2019 | $1,558 | $137,361 | $32,966 | $104,395 |
| 2018 | $1,536 | $132,030 | $31,687 | $100,343 |
| 2017 | $1,545 | $129,442 | $31,066 | $98,376 |
| 2016 | $1,518 | $126,905 | $30,457 | $96,448 |
| 2015 | $924 | $66,834 | $15,027 | $51,807 |
| 2014 | $865 | $65,526 | $14,733 | $50,793 |
Source: Public Records
Map
Nearby Homes
- 901 Belmont St
- 622 Dover St
- 609 Dover St
- 602 Dover Place
- 142 W 11th Place
- 146 W 11th Place
- 432 Dover Place
- 420 Dover Place
- 334 Albany St
- 430 Fremont St
- 814 Encanto Way
- 0 S High St
- 328 Dover Place
- 441 14th Ave
- 718 Florito Way
- 1417 Ellington St
- 1942 Clinton St
- 123 Dover St
- 339 Glenwood St
- 1010 Main St
Your Personal Tour Guide
Ask me questions while you tour the home.