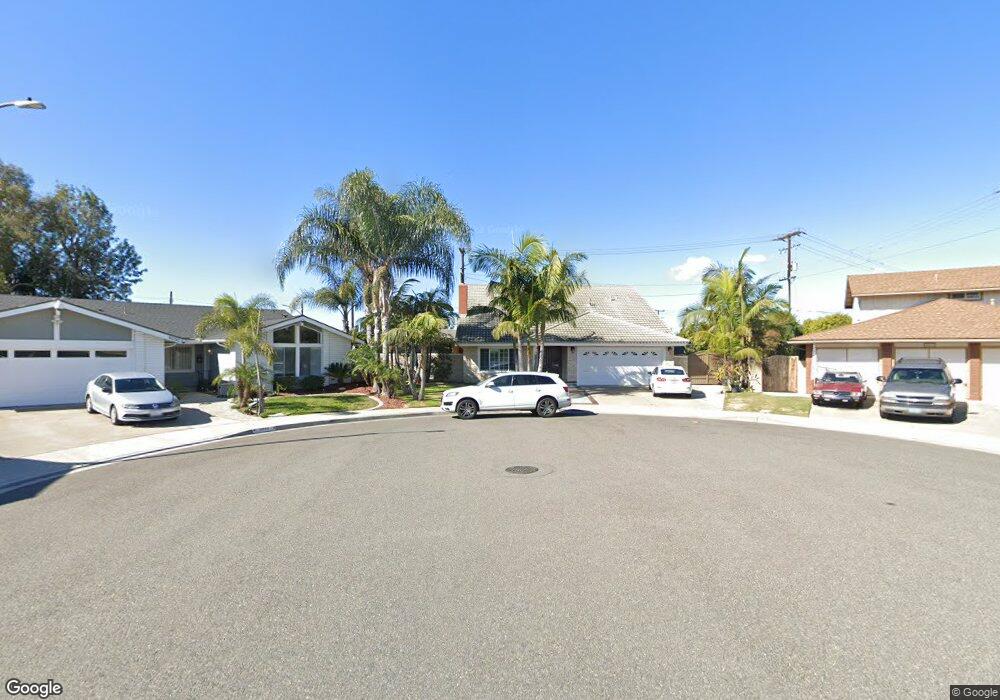
9025 Maza Cir Fountain Valley, CA 92708
Star View NeighborhoodEstimated Value: $1,423,000 - $1,617,000
4
Beds
3
Baths
2,000
Sq Ft
$774/Sq Ft
Est. Value
About This Home
This home is located at 9025 Maza Cir, Fountain Valley, CA 92708 and is currently estimated at $1,547,712, approximately $773 per square foot. 9025 Maza Cir is a home located in Orange County with nearby schools including Plavan (Urbain H.) Elementary School, Masuda (Kazuo) Middle School, and Fountain Valley High School.
Ownership History
Date
Name
Owned For
Owner Type
Purchase Details
Closed on
Nov 28, 2018
Sold by
Nguyen Mindy
Bought by
Nguyen Mindy
Current Estimated Value
Purchase Details
Closed on
Sep 2, 2017
Sold by
Nguyen Mindy
Bought by
Nguyen Mindy and The Mindy Nguyen Revocable Living Trust
Purchase Details
Closed on
Oct 10, 2016
Sold by
Pham Tram
Bought by
Nguyen Mindy
Purchase Details
Closed on
Oct 7, 2016
Sold by
Nguyen Long
Bought by
Nguyen Mindy
Purchase Details
Closed on
Dec 17, 2010
Sold by
Nguyen Long Thanh
Bought by
Pham Tram
Purchase Details
Closed on
Dec 20, 2007
Sold by
Yaghmourian Parsegh and Yaghmourian Marie
Bought by
Nguyen Long Thanh and Pham Tram
Home Financials for this Owner
Home Financials are based on the most recent Mortgage that was taken out on this home.
Original Mortgage
$417,000
Outstanding Balance
$261,889
Interest Rate
6.15%
Mortgage Type
Purchase Money Mortgage
Estimated Equity
$1,285,823
Create a Home Valuation Report for This Property
The Home Valuation Report is an in-depth analysis detailing your home's value as well as a comparison with similar homes in the area
Home Values in the Area
Average Home Value in this Area
Purchase History
| Date | Buyer | Sale Price | Title Company |
|---|---|---|---|
| Nguyen Mindy | -- | None Available | |
| Nguyen Mindy | -- | None Available | |
| Nguyen Mindy | -- | None Available | |
| Nguyen Mindy | -- | None Available | |
| Pham Tram | -- | Orange Coast Title | |
| Nguyen Long Thanh | $600,000 | Ticor Title Company Brea |
Source: Public Records
Mortgage History
| Date | Status | Borrower | Loan Amount |
|---|---|---|---|
| Open | Nguyen Long Thanh | $417,000 |
Source: Public Records
Tax History Compared to Growth
Tax History
| Year | Tax Paid | Tax Assessment Tax Assessment Total Assessment is a certain percentage of the fair market value that is determined by local assessors to be the total taxable value of land and additions on the property. | Land | Improvement |
|---|---|---|---|---|
| 2025 | $10,495 | $963,283 | $736,628 | $226,655 |
| 2024 | $10,495 | $944,396 | $722,185 | $222,211 |
| 2023 | $10,250 | $925,879 | $708,025 | $217,854 |
| 2022 | $10,103 | $907,725 | $694,142 | $213,583 |
| 2021 | $9,906 | $889,927 | $680,531 | $209,396 |
| 2020 | $9,849 | $880,802 | $673,553 | $207,249 |
| 2019 | $9,642 | $863,532 | $660,346 | $203,186 |
| 2018 | $9,456 | $846,600 | $647,398 | $199,202 |
| 2017 | $8,553 | $753,865 | $512,344 | $241,521 |
| 2016 | $8,181 | $739,084 | $502,298 | $236,786 |
| 2015 | $7,889 | $712,143 | $494,753 | $217,390 |
| 2014 | $7,661 | $698,194 | $485,062 | $213,132 |
Source: Public Records
Map
Nearby Homes
- 16551 Ross Ln
- 9446 Gardenia Ave
- 16871 Ross Ln
- 9485 Geranium Cir
- 16806 Olive St
- 16767 Madrone Cir
- 16761 Irby Ln
- 8282 Bryant Dr
- 8822 Palos Verdes Ave
- 16781 Scotsdale Cir
- 9190 Poppy Cir
- 8841 Palos Verdes Ave
- 17215 Buttonwood St
- 9801 Hibiscus Ave
- 16379 Shadbush St
- 16782 Heritage Ln
- 15710 Poinsettia Way
- 16102 Malaga Ln
- 8342 Friesland Dr
- 17475 Santa Lucia St
- 9031 Maza Cir
- 9030 Maza Cir
- 9041 Maza Cir
- 9040 Maza Cir
- 16505 Magnolia St
- 9055 Maza Cir
- 9039 Wendy Cir
- 9031 Wendy Cir
- 9054 Maza Cir
- 9036 Buttercup Ave
- 9053 Wendy Cir
- 9067 Maza Cir
- 9066 Maza Cir
- 16467 Ponderosa St
- 9048 Buttercup Ave
- 9067 Wendy Cir
- 9060 Buttercup Ave
- 9038 Wendy Cir
- 9077 Maza Cir
- 16459 Ponderosa St