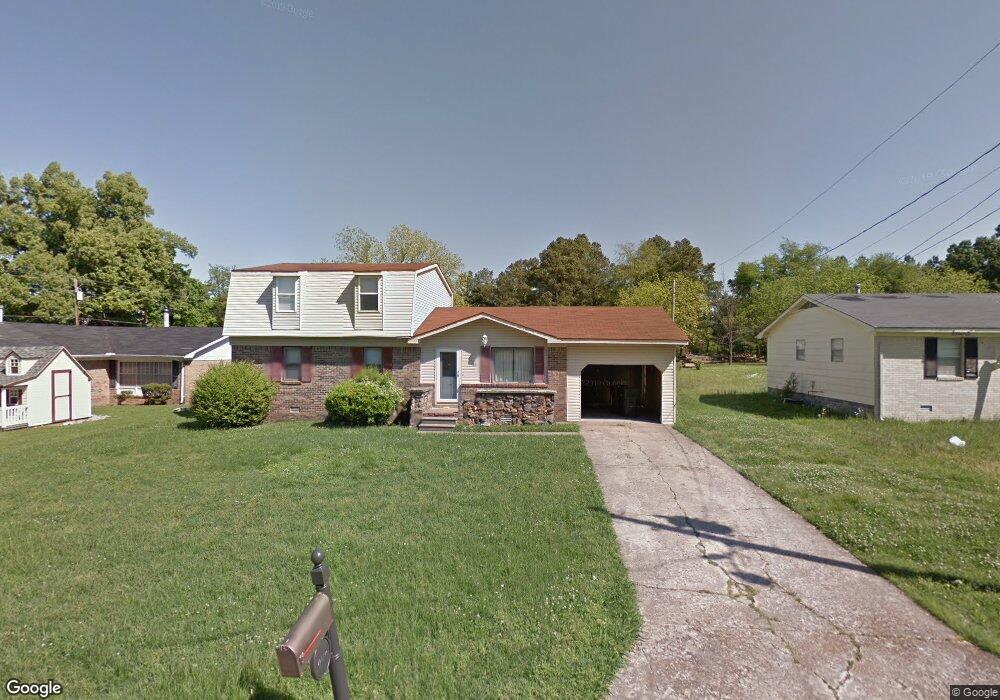
906 Jordon Terrace Union City, TN 38261
Estimated Value: $215,000 - $244,000
--
Bed
3
Baths
2,466
Sq Ft
$94/Sq Ft
Est. Value
About This Home
This home is located at 906 Jordon Terrace, Union City, TN 38261 and is currently estimated at $232,703, approximately $94 per square foot. 906 Jordon Terrace is a home located in Obion County with nearby schools including Union City Elementary School, Union City Middle School, and Union City High School.
Ownership History
Date
Name
Owned For
Owner Type
Purchase Details
Closed on
Jan 22, 2024
Sold by
Vanbrocklin Kevin and Vanbrocklin Stephanie
Bought by
Schoch Joshua and Schoch Rozilla
Current Estimated Value
Home Financials for this Owner
Home Financials are based on the most recent Mortgage that was taken out on this home.
Original Mortgage
$213,500
Outstanding Balance
$209,764
Interest Rate
6.95%
Mortgage Type
VA
Estimated Equity
$22,939
Purchase Details
Closed on
Nov 8, 2022
Sold by
Fulton Neal and Fulton Karen
Bought by
Vanbrocklin Kevin and Vanbrocklin Stephanie
Purchase Details
Closed on
Mar 28, 2012
Sold by
Sellars Charles E
Bought by
Neal Fulton
Purchase Details
Closed on
Aug 18, 2008
Sold by
Charles Sellers
Bought by
Charles Sellars
Purchase Details
Closed on
Jan 1, 1983
Bought by
Sellers Charles E and Sellers Marrice
Create a Home Valuation Report for This Property
The Home Valuation Report is an in-depth analysis detailing your home's value as well as a comparison with similar homes in the area
Home Values in the Area
Average Home Value in this Area
Purchase History
| Date | Buyer | Sale Price | Title Company |
|---|---|---|---|
| Schoch Joshua | $213,500 | None Listed On Document | |
| Vanbrocklin Kevin | $60,000 | -- | |
| Neal Fulton | $67,000 | -- | |
| Charles Sellars | -- | -- | |
| Sellers Charles E | $60,000 | -- |
Source: Public Records
Mortgage History
| Date | Status | Borrower | Loan Amount |
|---|---|---|---|
| Open | Schoch Joshua | $213,500 |
Source: Public Records
Tax History Compared to Growth
Tax History
| Year | Tax Paid | Tax Assessment Tax Assessment Total Assessment is a certain percentage of the fair market value that is determined by local assessors to be the total taxable value of land and additions on the property. | Land | Improvement |
|---|---|---|---|---|
| 2025 | -- | $40,175 | $0 | $0 |
| 2024 | -- | $39,600 | $2,500 | $37,100 |
| 2023 | $1,110 | $39,600 | $2,500 | $37,100 |
| 2022 | $452 | $28,250 | $2,500 | $25,750 |
| 2021 | $443 | $28,250 | $2,500 | $25,750 |
| 2020 | $452 | $28,250 | $2,500 | $25,750 |
| 2019 | $1,051 | $28,250 | $2,500 | $25,750 |
| 2018 | $1,045 | $28,250 | $2,500 | $25,750 |
| 2017 | $1,125 | $29,525 | $2,500 | $27,025 |
| 2016 | $1,125 | $29,525 | $2,500 | $27,025 |
| 2015 | $1,119 | $29,525 | $2,500 | $27,025 |
| 2014 | $1,119 | $29,525 | $2,500 | $27,025 |
Source: Public Records
Map
Nearby Homes
- 1009 E Cheatham St
- 1414 Forest Dr
- 841 Mosswood Dr
- 0 Mosswood Dr Unit RRA45928
- 0 Mosswood Dr Unit 44704
- 922 N Division St
- 903 Sherwood Dr
- 1449 Forest Dr
- 724 E Martin Luther King
- 803 E Main St
- 501 N 1st St
- 817 Exchange St
- 1813 E Vine St
- 610 Perkins St
- 42 Wilma Dr Unit Lot 42
- 38 Wilma Dr Unit Lot 38
- 49 Wilma Dr Unit Lot 49
- 39 Wilma Dr Unit Lot 39
- 37 Wilma Dr Unit Lot 37
- 616 S 3rd St
- 906 Jordan Street Terrace
- 906 Jordan Terrace
- 910 Jordan Street Terrace
- 902 Jordan Street Terrace
- 1309 N Clover St
- 914 Jordan Street Terrace
- 1209 N Clover St
- 909 Jordan Street Terrace
- 916 Jordan Street Terrace
- 1313 N Clover St
- 1300 N Clover St
- 1002 Jordan Street Terrace
- 1317 N Clover St
- 1210 N Clover St
- 1320 N Clover St
- 1006 Jordon Terrace
- 1006 Jordan Street Terrace
- 0 Jordan Terrace Unit RRA40576
- 0 Jordan Terrace
- 1325 N Clover St