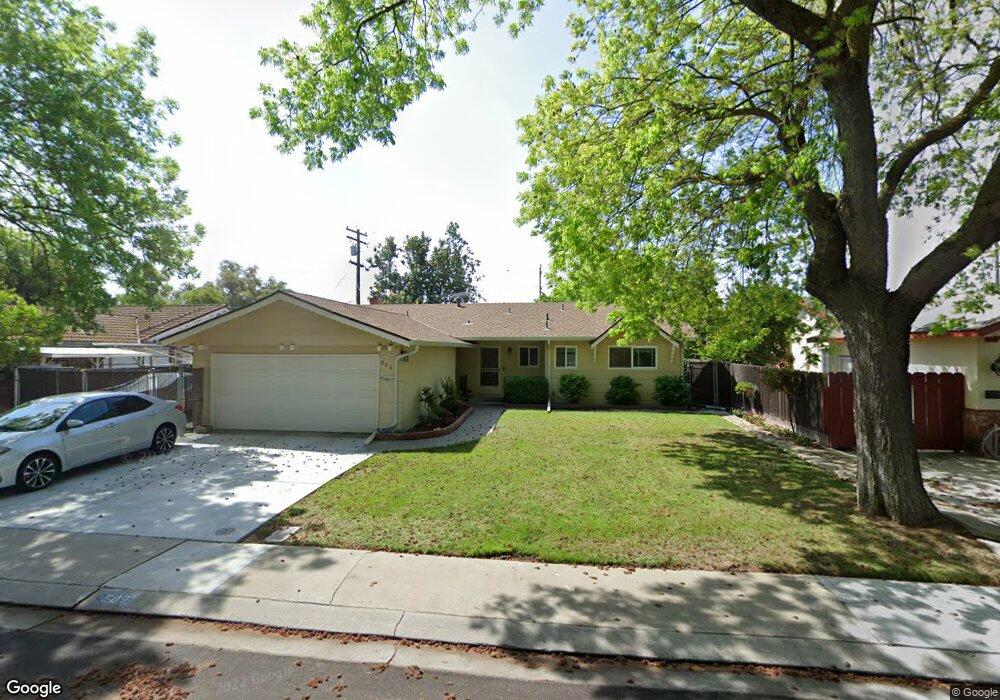
908 Charleston Ave Modesto, CA 95350
Central Modesto NeighborhoodEstimated Value: $414,922 - $440,000
3
Beds
2
Baths
1,307
Sq Ft
$328/Sq Ft
Est. Value
About This Home
This home is located at 908 Charleston Ave, Modesto, CA 95350 and is currently estimated at $428,481, approximately $327 per square foot. 908 Charleston Ave is a home located in Stanislaus County with nearby schools including Woodrow Elementary School, Somerset Middle School, and Grace M. Davis High School.
Ownership History
Date
Name
Owned For
Owner Type
Purchase Details
Closed on
Apr 11, 2003
Sold by
Barcelos John V and Barcelos Linda Charlene
Bought by
Barcelos John V and Barcelos Linda Charlene
Current Estimated Value
Home Financials for this Owner
Home Financials are based on the most recent Mortgage that was taken out on this home.
Original Mortgage
$92,500
Outstanding Balance
$39,299
Interest Rate
5.6%
Estimated Equity
$389,182
Purchase Details
Closed on
Jun 15, 2001
Sold by
Barcelos John V and Barcelos Charlene
Bought by
Barcelos John V and Barcelos Charlene
Purchase Details
Closed on
May 14, 1998
Sold by
Douglas Valeria O and Schoen Maynard L
Bought by
Barcelos John V and Barcelos Linda Charlene
Home Financials for this Owner
Home Financials are based on the most recent Mortgage that was taken out on this home.
Original Mortgage
$97,375
Interest Rate
7.11%
Purchase Details
Closed on
Apr 23, 1997
Sold by
Clark Elmer Ross and Clark Sylvia R
Bought by
Clark Elmer R and Clark Sylvia R
Create a Home Valuation Report for This Property
The Home Valuation Report is an in-depth analysis detailing your home's value as well as a comparison with similar homes in the area
Home Values in the Area
Average Home Value in this Area
Purchase History
| Date | Buyer | Sale Price | Title Company |
|---|---|---|---|
| Barcelos John V | -- | First American Title Co | |
| Barcelos John V | -- | First American Title Co | |
| Barcelos John V | -- | -- | |
| Barcelos John V | $103,500 | Chicago Title Co | |
| Clark Elmer R | -- | -- |
Source: Public Records
Mortgage History
| Date | Status | Borrower | Loan Amount |
|---|---|---|---|
| Open | Barcelos John V | $92,500 | |
| Closed | Barcelos John V | $97,375 |
Source: Public Records
Tax History
| Year | Tax Paid | Tax Assessment Tax Assessment Total Assessment is a certain percentage of the fair market value that is determined by local assessors to be the total taxable value of land and additions on the property. | Land | Improvement |
|---|---|---|---|---|
| 2025 | $1,731 | $163,645 | $47,891 | $115,754 |
| 2024 | $1,698 | $160,437 | $46,952 | $113,485 |
| 2023 | $1,664 | $157,292 | $46,032 | $111,260 |
| 2022 | $1,595 | $154,209 | $45,130 | $109,079 |
| 2021 | $1,566 | $151,187 | $44,246 | $106,941 |
| 2020 | $1,543 | $149,638 | $43,793 | $105,845 |
| 2019 | $1,513 | $146,705 | $42,935 | $103,770 |
| 2018 | $1,482 | $143,830 | $42,094 | $101,736 |
| 2017 | $1,445 | $141,011 | $41,269 | $99,742 |
| 2016 | $1,435 | $138,247 | $40,460 | $97,787 |
| 2015 | $1,413 | $136,172 | $39,853 | $96,319 |
| 2014 | $1,406 | $133,506 | $39,073 | $94,433 |
Source: Public Records
Map
Nearby Homes
- 1005 Woodrow Ave
- 3417 John Lee Ln
- 1013 Colonial Ct
- 3432 Colonial Dr
- 3312 Whitehorse Ave
- 365 Birchwood Ct
- 3600 Columbine Dr Unit 6
- 3025 Tully Rd
- 1400 Rosemead Ct
- 3701 Colonial Dr Unit 202
- 3701 Colonial Dr
- 3701 Colonial Dr Unit 98
- 3701 Colonial Dr Unit 164
- 3701 Colonial Dr Unit 89
- 3701 Colonial Dr Unit 197
- 3701 Colonial Dr Unit 36
- 325 Standiford Ave Unit 29
- 3700 Tully Rd Unit 57
- 2860 Sherwood Ave Unit B
- 1436 Montclair Dr
- 904 Charleston Ave
- 909 Woodrow Ave
- 905 Woodrow Ave
- 913 Woodrow Ave
- 916 Charleston Ave
- 3309 John Lee Ln
- 909 Charleston Ave
- 913 Charleston Ave
- 905 Charleston Ave
- 3301 John Lee Ln
- 917 Charleston Ave
- 3317 John Lee Ln
- 921 Charleston Ave
- 908 Kevin Ct
- 912 Kevin Ct
- 904 Kevin Ct
- 3308 John Lee Ln
- 916 Kevin Ct
- 3300 John Lee Ln
- 925 Charleston Ave
Your Personal Tour Guide
Ask me questions while you tour the home.