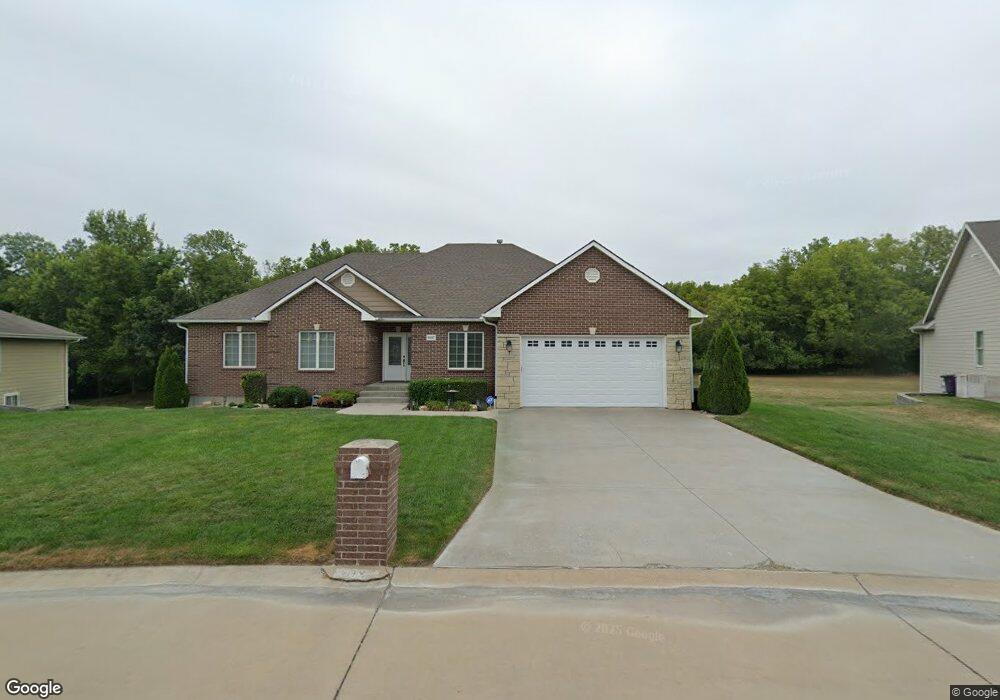
9087 Tonya Terrace Manhattan, KS 66502
Estimated Value: $446,000 - $470,000
6
Beds
3
Baths
4,200
Sq Ft
$109/Sq Ft
Est. Value
About This Home
This home is located at 9087 Tonya Terrace, Manhattan, KS 66502 and is currently estimated at $457,930, approximately $109 per square foot. 9087 Tonya Terrace is a home located in Pottawatomie County with nearby schools including Woodrow Wilson Elementary School, Dwight D. Eisenhower Middle School, and Manhattan High School.
Ownership History
Date
Name
Owned For
Owner Type
Purchase Details
Closed on
Apr 15, 2009
Sold by
Terrill Jay D and Terrilll Sherese R
Bought by
Kiefer Coleen M and Castillo Ricardo A
Current Estimated Value
Home Financials for this Owner
Home Financials are based on the most recent Mortgage that was taken out on this home.
Original Mortgage
$260,000
Outstanding Balance
$163,477
Interest Rate
4.84%
Estimated Equity
$294,453
Purchase Details
Closed on
Oct 31, 2006
Sold by
Gallagher Edwin F and Gallagher Amy N
Bought by
Terrill Jay and Hahn Sherese
Home Financials for this Owner
Home Financials are based on the most recent Mortgage that was taken out on this home.
Original Mortgage
$270,400
Interest Rate
6.25%
Mortgage Type
Adjustable Rate Mortgage/ARM
Purchase Details
Closed on
Feb 8, 2005
Sold by
Rees Development Company Inc
Bought by
Gallagher Edwin F and Gallagher Amy N
Create a Home Valuation Report for This Property
The Home Valuation Report is an in-depth analysis detailing your home's value as well as a comparison with similar homes in the area
Home Values in the Area
Average Home Value in this Area
Purchase History
| Date | Buyer | Sale Price | Title Company |
|---|---|---|---|
| Kiefer Coleen M | -- | None Available | |
| Terrill Jay | -- | None Available | |
| Gallagher Edwin F | -- | None Available |
Source: Public Records
Mortgage History
| Date | Status | Borrower | Loan Amount |
|---|---|---|---|
| Open | Kiefer Coleen M | $260,000 | |
| Previous Owner | Terrill Jay | $270,400 |
Source: Public Records
Tax History Compared to Growth
Tax History
| Year | Tax Paid | Tax Assessment Tax Assessment Total Assessment is a certain percentage of the fair market value that is determined by local assessors to be the total taxable value of land and additions on the property. | Land | Improvement |
|---|---|---|---|---|
| 2025 | $4,650 | $49,304 | $5,069 | $44,235 |
| 2024 | $47 | $47,782 | $5,053 | $42,729 |
| 2023 | $4,822 | $47,421 | $4,920 | $42,501 |
| 2022 | $3,920 | $41,597 | $4,867 | $36,730 |
| 2021 | $3,920 | $38,516 | $4,729 | $33,787 |
| 2020 | $3,920 | $38,287 | $4,729 | $33,558 |
| 2019 | $4,004 | $38,599 | $4,591 | $34,008 |
| 2018 | $3,892 | $38,559 | $3,972 | $34,587 |
| 2017 | $3,814 | $38,560 | $3,810 | $34,750 |
| 2016 | $3,938 | $40,491 | $3,330 | $37,161 |
| 2015 | -- | $39,675 | $3,641 | $36,034 |
| 2014 | -- | $39,997 | $3,946 | $36,051 |
Source: Public Records
Map
Nearby Homes
- 4658 Pierce Dr
- 6100 Tumbleweed Terrace
- 9168 Dave Dr
- 9176 Dave Dr
- 4852 Nature Ave
- 4860 Nature Ave
- 4884 Nature Ave
- 4881 Nature Ave
- 4314 Aspen Dr
- 4876 Nature Ave
- 4665 Sunflower Slope Dr
- 4319 Aspen Dr
- 4098 Tyler Ct
- 4105 Tyler Ct
- 8796 N Kelliann Way
- 8746 S Kelliann Way
- 8739 Eagles Landing Dr
- Matthew Plan at Nelson Ridge
- Madeline Plan at Nelson Ridge
- Mateo Plan at Nelson Ridge
- 9083 Tonya Terrace
- 9091 Tonya Terrace
- 9079 Tonya Terrace
- 9094 Tonya Terrace
- 9086 Tonya Terrace
- 9073 Tonya Terrace
- 9082 Tonya Terrace
- 9098 Tonya Terrace
- 9101 Tonya Terrace
- 9078 Tonya Terrace
- 9065 Tonya Terrace
- 9104 Tonya Terrace
- 9105 Tonya Terrace
- 6142 Brookes Way
- 6138 Brookes Way
- 9066 Tonya Terrace
- 9074 Tonya Terrace
- 6134 Brookes Way
- 9061 Tonya Terrace
- 4402 Brookes Ct