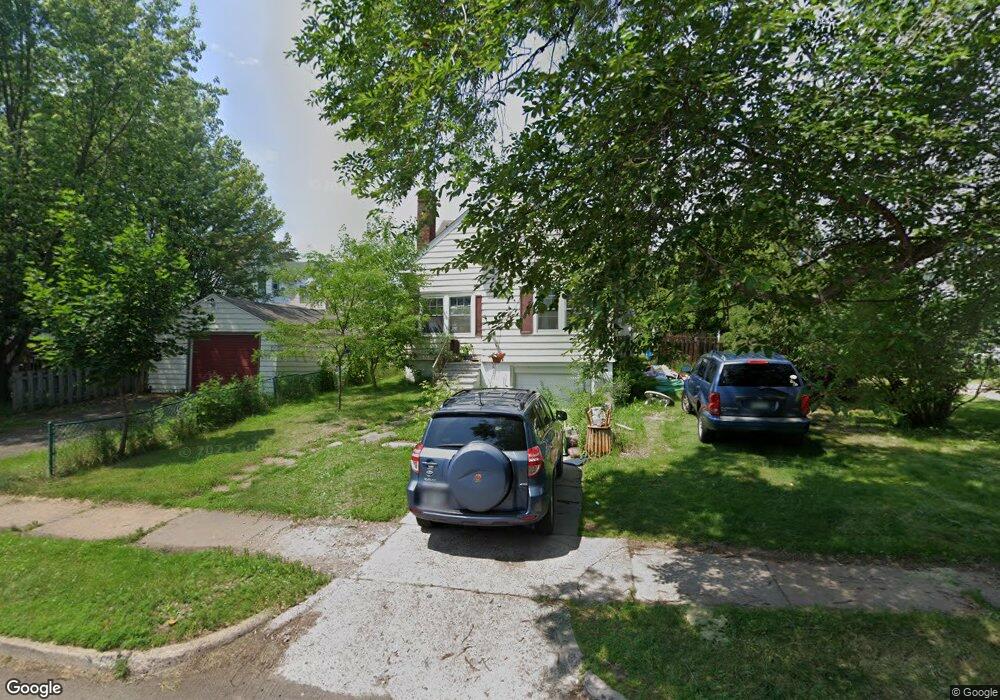
909 E 10th St Duluth, MN 55805
East Hillside NeighborhoodEstimated Value: $219,562 - $264,000
3
Beds
1
Bath
1,434
Sq Ft
$172/Sq Ft
Est. Value
About This Home
This home is located at 909 E 10th St, Duluth, MN 55805 and is currently estimated at $246,141, approximately $171 per square foot. 909 E 10th St is a home located in St. Louis County with nearby schools including Ordean East Middle School, East High School, and Many Rivers Montessori School.
Ownership History
Date
Name
Owned For
Owner Type
Purchase Details
Closed on
Nov 17, 2009
Sold by
Langlais Michael D and Langlais Evelyn K
Bought by
Sternberg Paul and Sternberg Jennifer
Current Estimated Value
Home Financials for this Owner
Home Financials are based on the most recent Mortgage that was taken out on this home.
Original Mortgage
$3,000
Outstanding Balance
$1,964
Interest Rate
5.05%
Mortgage Type
Unknown
Estimated Equity
$244,177
Purchase Details
Closed on
Aug 17, 2006
Sold by
Zervas Charlene F and Zervas Thomas G
Bought by
Langlais Michael D and Langlais Evelyn K
Home Financials for this Owner
Home Financials are based on the most recent Mortgage that was taken out on this home.
Original Mortgage
$2,000
Interest Rate
6.88%
Mortgage Type
Unknown
Purchase Details
Closed on
May 5, 2004
Sold by
Clarine Mildred M
Bought by
Zervas Charlene F and Rawlings Colleen C
Create a Home Valuation Report for This Property
The Home Valuation Report is an in-depth analysis detailing your home's value as well as a comparison with similar homes in the area
Home Values in the Area
Average Home Value in this Area
Purchase History
| Date | Buyer | Sale Price | Title Company |
|---|---|---|---|
| Sternberg Paul | $116,000 | Arrowhead Abstract | |
| Langlais Michael D | $115,000 | Arrowhead Abstract & Title C | |
| Zervas Charlene F | -- | -- |
Source: Public Records
Mortgage History
| Date | Status | Borrower | Loan Amount |
|---|---|---|---|
| Open | Sternberg Paul | $3,000 | |
| Open | Sternberg Paul | $112,520 | |
| Previous Owner | Langlais Michael D | $2,000 | |
| Previous Owner | Langlais Michael D | $114,600 |
Source: Public Records
Tax History
| Year | Tax Paid | Tax Assessment Tax Assessment Total Assessment is a certain percentage of the fair market value that is determined by local assessors to be the total taxable value of land and additions on the property. | Land | Improvement |
|---|---|---|---|---|
| 2024 | $2,600 | $213,100 | $18,500 | $194,600 |
| 2023 | $2,600 | $187,700 | $22,100 | $165,600 |
| 2022 | $1,954 | $177,600 | $20,800 | $156,800 |
| 2021 | $1,918 | $139,600 | $20,900 | $118,700 |
| 2020 | $1,864 | $139,600 | $20,900 | $118,700 |
| 2019 | $2,018 | $133,500 | $19,900 | $113,600 |
| 2018 | $1,436 | $123,300 | $19,900 | $103,400 |
| 2017 | $1,306 | $116,300 | $19,300 | $97,000 |
| 2016 | $1,280 | $85,100 | $27,300 | $57,800 |
| 2015 | $1,300 | $80,800 | $16,300 | $64,500 |
| 2014 | $1,300 | $80,800 | $16,300 | $64,500 |
Source: Public Records
Map
Nearby Homes
- 1027 E 9th St
- XXX E Ninth St
- 908 E Skyline Pkwy
- 902 N 11th Ave E
- 706 E 11th St
- 1011 N 12th Ave E
- 701 E 11th St
- 1125 N 7th Ave E
- 1023 E 5th St
- 1403 E 8th St
- XXX E 13th St
- 419 N 13th Ave E
- 1126 Mesaba Ave Unit 119
- 517 E 5th St
- 418 N 13th Ave E
- 409 E 6th St
- 1205 E 3rd St
- 722 E 3rd St
- 609 N 4th Ave E
- 719 N 16th Ave E
- 915 E 10th St
- 1012 N 9th Ave E
- 905 E 10th St
- 917 E 10th St
- 1016 N 9th Ave E
- 1016 N 9th Ave E
- 921 E 10th St
- 1018 N 9th Ave E
- 930 N 9th Ave E
- 912 E 11th St
- 914 E 10th St
- 914 E 11th St
- 908 E 10th St
- 928 N 9th Ave E
- 1020 N 9th Ave E
- 918 E 11th St
- 918 918 E 11th St
- 920 E 10th St
- 920 N 9th Ave E
- 1009 N 10th Ave E
Your Personal Tour Guide
Ask me questions while you tour the home.