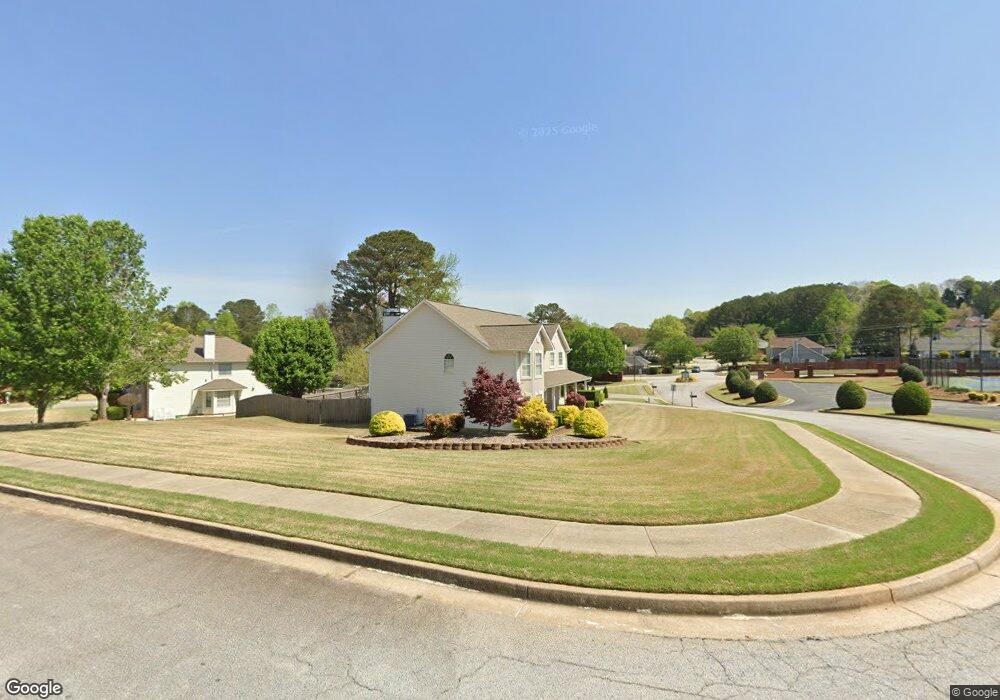
91 Arbor Cove Dr Unit 1 Stockbridge, GA 30281
Estimated Value: $356,000 - $386,000
3
Beds
3
Baths
3,086
Sq Ft
$119/Sq Ft
Est. Value
About This Home
This home is located at 91 Arbor Cove Dr Unit 1, Stockbridge, GA 30281 and is currently estimated at $366,432, approximately $118 per square foot. 91 Arbor Cove Dr Unit 1 is a home located in Henry County with nearby schools including Red Oak Elementary School, Dutchtown Middle School, and Dutchtown High School.
Ownership History
Date
Name
Owned For
Owner Type
Purchase Details
Closed on
Oct 27, 2017
Sold by
Mccrary Harold E
Bought by
Soesman Mark J and Soesman Samneang C
Current Estimated Value
Home Financials for this Owner
Home Financials are based on the most recent Mortgage that was taken out on this home.
Original Mortgage
$180,500
Outstanding Balance
$150,809
Interest Rate
3.83%
Mortgage Type
New Conventional
Estimated Equity
$215,623
Purchase Details
Closed on
May 4, 1999
Sold by
Blair Hiram N and Blair Teresa K
Bought by
Mccrary Harold E and Mccrary Phyllis
Home Financials for this Owner
Home Financials are based on the most recent Mortgage that was taken out on this home.
Original Mortgage
$147,800
Interest Rate
6.84%
Mortgage Type
New Conventional
Purchase Details
Closed on
Sep 29, 1995
Sold by
Jonesinc Herman
Bought by
Blair Hiram Teresa
Create a Home Valuation Report for This Property
The Home Valuation Report is an in-depth analysis detailing your home's value as well as a comparison with similar homes in the area
Home Values in the Area
Average Home Value in this Area
Purchase History
| Date | Buyer | Sale Price | Title Company |
|---|---|---|---|
| Soesman Mark J | $190,000 | -- | |
| Mccrary Harold E | $173,900 | -- | |
| Blair Hiram Teresa | $158,900 | -- | |
| Blair Hiram Neil Teresa | $158,900 | -- |
Source: Public Records
Mortgage History
| Date | Status | Borrower | Loan Amount |
|---|---|---|---|
| Open | Soesman Mark J | $180,500 | |
| Previous Owner | Mccrary Harold E | $147,800 | |
| Closed | Blair Hiram Neil Teresa | $0 |
Source: Public Records
Tax History Compared to Growth
Tax History
| Year | Tax Paid | Tax Assessment Tax Assessment Total Assessment is a certain percentage of the fair market value that is determined by local assessors to be the total taxable value of land and additions on the property. | Land | Improvement |
|---|---|---|---|---|
| 2025 | $4,845 | $151,400 | $16,000 | $135,400 |
| 2024 | $4,845 | $136,360 | $16,000 | $120,360 |
| 2023 | $4,214 | $137,560 | $14,000 | $123,560 |
| 2022 | $3,764 | $123,040 | $14,000 | $109,040 |
| 2021 | $3,084 | $94,280 | $12,000 | $82,280 |
| 2020 | $3,053 | $92,960 | $10,000 | $82,960 |
| 2019 | $2,829 | $83,480 | $10,000 | $73,480 |
| 2018 | $2,652 | $76,000 | $9,576 | $66,424 |
| 2016 | $85 | $65,360 | $8,000 | $57,360 |
| 2015 | $85 | $58,720 | $6,000 | $52,720 |
| 2014 | $85 | $50,640 | $6,000 | $44,640 |
Source: Public Records
Map
Nearby Homes
- 486 Village Cir
- 235 Alexis Ave
- 469 Village Cir
- 184 Eagle Way
- 213 Baron Ct
- 318 Eagle Ct
- 263 Northwind Dr
- 600 Dairy Dr
- 1341 Kent Manor Unit 3
- 404 Northwind Place
- 377 Avian Forest Dr
- 564 Goldfinch Way
- 213 Sunderland Way Unit 1
- 1545 Brangus Dr
- 1653 Jersey Dr
- 396 Avian Forest Dr
- 537 Goldfinch Way
- 137 Dustin Dr
- 924 Dexter Dr
- 9 Cheyenne Dr
- 91 Arbor Cove Dr
- 91 Arbor Cove Dr
- 212 Arbor Cove Ct
- 0 Arbor Cove Ct Unit 8232325
- 0 Arbor Cove Ct Unit 7437641
- 99 Arbor Cove Dr
- 88 Arbor Cove Dr Unit 1
- 201 Arbor Cove Ct Unit 1
- 205 Arbor Cove Ct Unit 1
- 84 Arbor Cove Dr
- 220 Arbor Cove Ct Unit 1
- 209 Arbor Cove Ct Unit 1
- 80 Arbor Cove Dr Unit 1
- 213 Arbor Cove Ct Unit 1
- 0 Arbor Cove Dr Unit 8827051
- 0 Arbor Cove Dr Unit 8628266
- 0 Arbor Cove Dr Unit 8615103
- 0 Arbor Cove Dr Unit 8553668
- 0 Arbor Cove Dr Unit 9008108
- 0 Arbor Cove Dr Unit 3123900