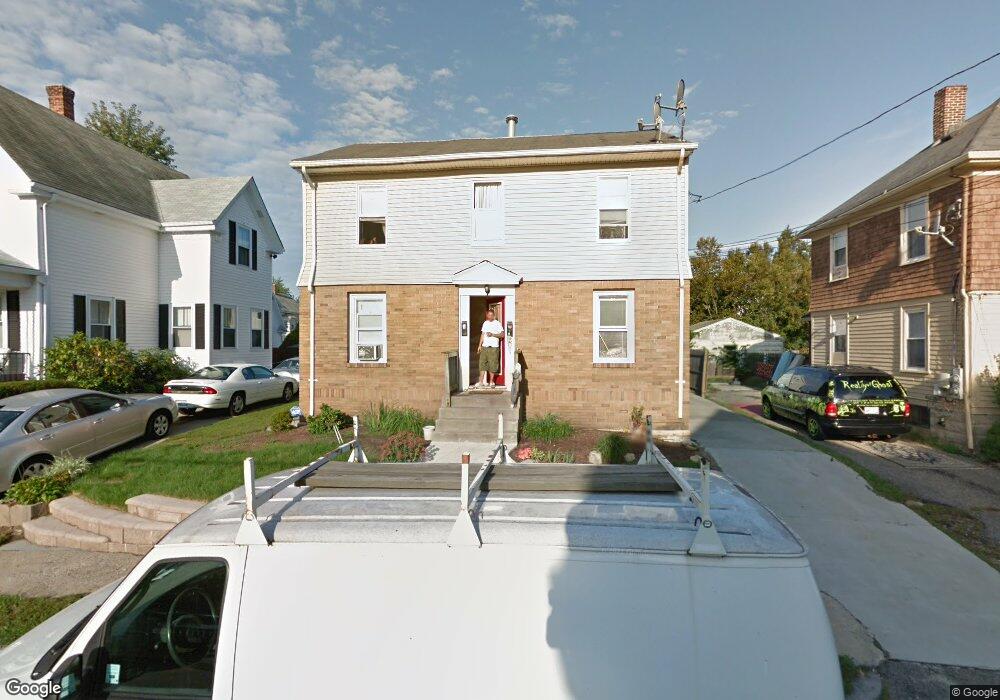
91 Potter St Cranston, RI 02910
Auburn NeighborhoodEstimated Value: $416,981 - $475,000
4
Beds
2
Baths
1,636
Sq Ft
$279/Sq Ft
Est. Value
About This Home
This home is located at 91 Potter St, Cranston, RI 02910 and is currently estimated at $455,995, approximately $278 per square foot. 91 Potter St is a home located in Providence County with nearby schools including Eden Park Elementary School, Park View Middle School, and Cranston High School East.
Ownership History
Date
Name
Owned For
Owner Type
Purchase Details
Closed on
Oct 15, 2010
Sold by
Castellucci Dina R
Bought by
Eljerai Naji W
Current Estimated Value
Home Financials for this Owner
Home Financials are based on the most recent Mortgage that was taken out on this home.
Original Mortgage
$154,913
Outstanding Balance
$101,878
Interest Rate
4.36%
Mortgage Type
Purchase Money Mortgage
Estimated Equity
$354,117
Purchase Details
Closed on
Dec 5, 2008
Sold by
Cinaci Steven A
Bought by
Federal National Mortgage Association
Purchase Details
Closed on
Aug 27, 1999
Sold by
Ferland Carol A
Bought by
Cianci Steven A
Purchase Details
Closed on
Jul 21, 1997
Sold by
Bolton Cheryl M
Bought by
Ferland Carol A
Create a Home Valuation Report for This Property
The Home Valuation Report is an in-depth analysis detailing your home's value as well as a comparison with similar homes in the area
Home Values in the Area
Average Home Value in this Area
Purchase History
| Date | Buyer | Sale Price | Title Company |
|---|---|---|---|
| Eljerai Naji W | $157,000 | -- | |
| Federal National Mortgage Association | $157,000 | -- | |
| Cianci Steven A | $25,000 | -- | |
| Ferland Carol A | $95,000 | -- |
Source: Public Records
Mortgage History
| Date | Status | Borrower | Loan Amount |
|---|---|---|---|
| Open | Ferland Carol A | $154,913 | |
| Previous Owner | Ferland Carol A | $137,464 | |
| Previous Owner | Ferland Carol A | $140,000 |
Source: Public Records
Tax History Compared to Growth
Tax History
| Year | Tax Paid | Tax Assessment Tax Assessment Total Assessment is a certain percentage of the fair market value that is determined by local assessors to be the total taxable value of land and additions on the property. | Land | Improvement |
|---|---|---|---|---|
| 2025 | $4,546 | $327,500 | $93,600 | $233,900 |
| 2024 | $4,457 | $327,500 | $93,600 | $233,900 |
| 2023 | $4,239 | $224,300 | $64,600 | $159,700 |
| 2022 | $4,152 | $224,300 | $64,600 | $159,700 |
| 2021 | $4,037 | $224,300 | $64,600 | $159,700 |
| 2020 | $3,903 | $187,900 | $61,300 | $126,600 |
| 2019 | $3,903 | $187,900 | $61,300 | $126,600 |
| 2018 | $3,812 | $187,900 | $61,300 | $126,600 |
| 2017 | $3,436 | $149,800 | $45,200 | $104,600 |
| 2016 | $3,363 | $149,800 | $45,200 | $104,600 |
| 2015 | $3,363 | $149,800 | $45,200 | $104,600 |
| 2014 | $3,211 | $140,600 | $45,200 | $95,400 |
Source: Public Records
Map
Nearby Homes
- 124 Clarence St
- 483 Pontiac Ave
- 1 Rolfe Square
- 36 Blackamore Ave
- 152 Woodbine St
- 51 Norfolk St
- 18 Glenwood Ave
- 140 Concord Ave
- 75 High School Ave
- 115 Norfolk St
- 638 Pontiac Ave
- 129 Wollaston St
- 130 Wollaston St
- 105 Broadmoor Rd
- 140 Eldridge St
- 128 Elsie St
- 12 Stevens Rd
- 10 Woburn St
- 555 Park Ave
- 1264 Elmwood Ave