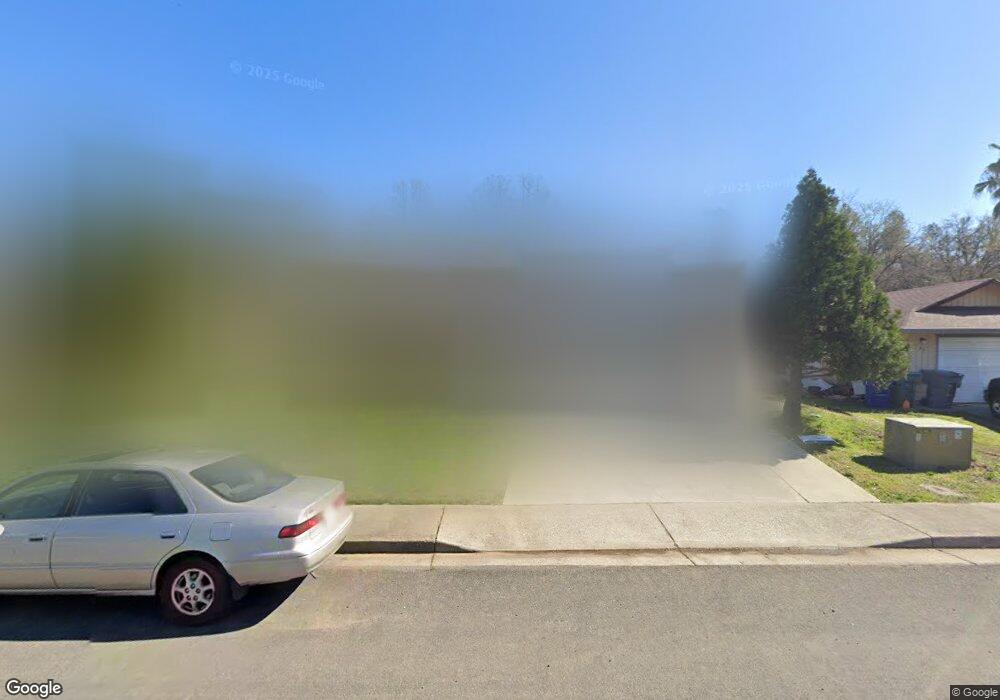
91 Tidmore Ln Unit 1 Redding, CA 96003
Simpson University Region NeighborhoodEstimated Value: $370,223 - $471,000
4
Beds
2
Baths
1,744
Sq Ft
$243/Sq Ft
Est. Value
About This Home
This home is located at 91 Tidmore Ln Unit 1, Redding, CA 96003 and is currently estimated at $423,056, approximately $242 per square foot. 91 Tidmore Ln Unit 1 is a home located in Shasta County with nearby schools including Columbia Elementary School, Mountain View Middle School, and Foothill High School.
Ownership History
Date
Name
Owned For
Owner Type
Purchase Details
Closed on
Mar 2, 2023
Sold by
Heier Samuel and Heier Jodel
Bought by
Heier Family 2023 Trust
Current Estimated Value
Purchase Details
Closed on
May 2, 2003
Sold by
Heier Samuel
Bought by
Heier Samuel and Heier Jodel
Purchase Details
Closed on
Jan 11, 2003
Sold by
Marienthal Barbara
Bought by
Marienthal Kim
Home Financials for this Owner
Home Financials are based on the most recent Mortgage that was taken out on this home.
Original Mortgage
$116,000
Interest Rate
4.5%
Mortgage Type
Purchase Money Mortgage
Purchase Details
Closed on
Jan 8, 2003
Sold by
Stevens Lena and Stevens Jose
Bought by
Heier Samuel
Home Financials for this Owner
Home Financials are based on the most recent Mortgage that was taken out on this home.
Original Mortgage
$116,000
Interest Rate
4.5%
Mortgage Type
Purchase Money Mortgage
Create a Home Valuation Report for This Property
The Home Valuation Report is an in-depth analysis detailing your home's value as well as a comparison with similar homes in the area
Home Values in the Area
Average Home Value in this Area
Purchase History
| Date | Buyer | Sale Price | Title Company |
|---|---|---|---|
| Heier Family 2023 Trust | -- | -- | |
| Heier Samuel | -- | Placer Title Company | |
| Marienthal Kim | -- | Placer Title Company | |
| Heier Samuel | $145,000 | Placer Title Company | |
| Heier Samuel | -- | Placer Title Company |
Source: Public Records
Mortgage History
| Date | Status | Borrower | Loan Amount |
|---|---|---|---|
| Previous Owner | Heier Samuel | $116,000 | |
| Closed | Heier Samuel | $14,500 |
Source: Public Records
Tax History Compared to Growth
Tax History
| Year | Tax Paid | Tax Assessment Tax Assessment Total Assessment is a certain percentage of the fair market value that is determined by local assessors to be the total taxable value of land and additions on the property. | Land | Improvement |
|---|---|---|---|---|
| 2025 | $2,372 | $209,985 | $50,680 | $159,305 |
| 2024 | $2,379 | $205,869 | $49,687 | $156,182 |
| 2023 | $2,379 | $201,833 | $48,713 | $153,120 |
| 2022 | $2,292 | $197,876 | $47,758 | $150,118 |
| 2021 | $2,282 | $193,997 | $46,822 | $147,175 |
| 2020 | $2,266 | $192,008 | $46,342 | $145,666 |
| 2019 | $2,214 | $188,244 | $45,434 | $142,810 |
| 2018 | $2,225 | $184,554 | $44,544 | $140,010 |
| 2017 | $2,250 | $180,936 | $43,671 | $137,265 |
| 2016 | $2,111 | $177,389 | $42,815 | $134,574 |
| 2015 | $2,078 | $174,725 | $42,172 | $132,553 |
| 2014 | $2,022 | $171,303 | $41,346 | $129,957 |
Source: Public Records
Map
Nearby Homes
- 40 Ortega Ct
- 60 Rose Ln
- 1381 Chaos Walk
- 19219 Nike Ct
- 693 Yolla Bolly Trail
- 624 Volcano View Trail
- 2147 Edinburgh Way
- 790 Volcano View Trail
- 866 Fountain Cir
- 2154 Harvard Way
- 2110 Cilantro Dr
- 1102 Hope Ln
- 948 & 950 Hawley
- 667 Reddington Dr
- 550 Armando Ave
- 11632 Ridgewood Rd
- 5663 Terra Linda Way
- 6572 Jonella Way
- 592 Mill Valley Pkwy
- 5589 Trish Ct
- 91 Tidmore Ln
- 99 Tidmore Ln
- 87 Tidmore Ln Unit 1
- 87 Tidmore Ln
- 83 Tidmore Ln
- 96 Tidmore Ln
- 75 Tidmore Ln
- 1604 Dakota Way
- 78 Tidmore Ln Unit 1
- 78 Tidmore Ln
- 61 Tidmore Ln
- 66 Tidmore Ln
- 57 Tidmore Ln
- 54 Tidmore Ln
- 1611 Dakota Way
- 1620 Tidmore Ln
- 42 Tidmore Ln
- 1624 Dakota Way
- 45 Tidmore Ln
- 1646 Dakota Way