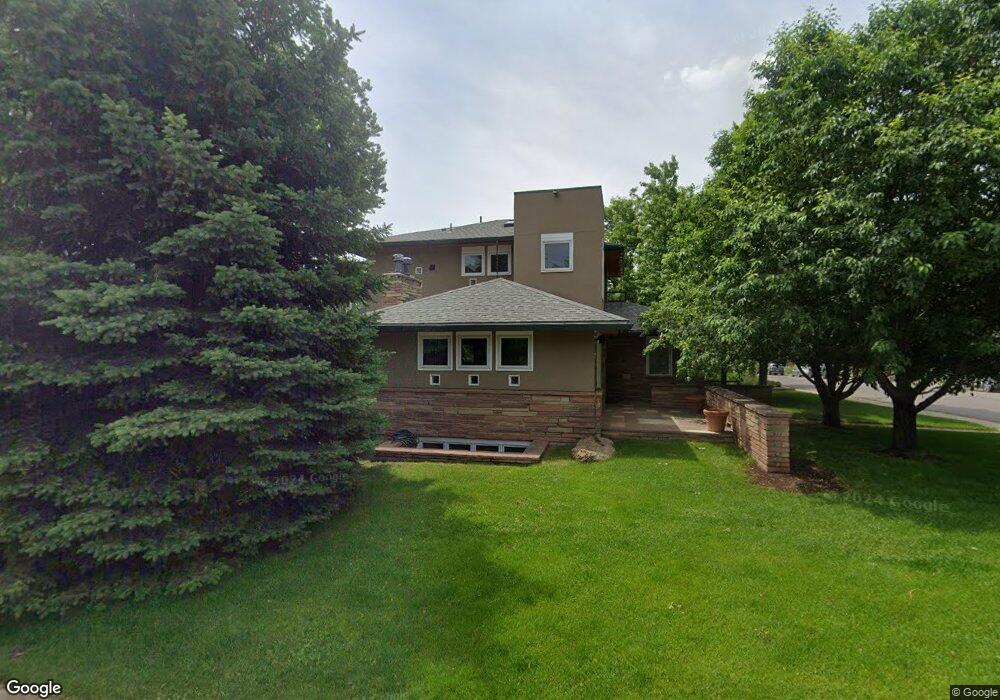
910 Grape Ave Boulder, CO 80304
Newlands NeighborhoodEstimated Value: $1,732,329 - $2,108,000
6
Beds
3
Baths
2,031
Sq Ft
$969/Sq Ft
Est. Value
About This Home
This home is located at 910 Grape Ave, Boulder, CO 80304 and is currently estimated at $1,967,332, approximately $968 per square foot. 910 Grape Ave is a home located in Boulder County with nearby schools including Foothill Elementary School, Casey Middle School, and Boulder High School.
Ownership History
Date
Name
Owned For
Owner Type
Purchase Details
Closed on
Mar 8, 2021
Sold by
Faber James L and Faber Mona M
Bought by
Faber Family Trust
Current Estimated Value
Purchase Details
Closed on
Apr 23, 1999
Sold by
Quinn Perry M
Bought by
Faber James L and Faber Mona M
Home Financials for this Owner
Home Financials are based on the most recent Mortgage that was taken out on this home.
Original Mortgage
$224,000
Outstanding Balance
$57,288
Interest Rate
7.16%
Estimated Equity
$1,910,044
Purchase Details
Closed on
Apr 17, 1997
Sold by
Joan Blackmer George E and Joan R
Bought by
Quinn Perry M
Home Financials for this Owner
Home Financials are based on the most recent Mortgage that was taken out on this home.
Original Mortgage
$162,500
Interest Rate
7.82%
Purchase Details
Closed on
Jun 5, 1975
Bought by
Faber James L and Faber Mona M
Purchase Details
Closed on
Feb 20, 1975
Bought by
Faber James L and Faber Mona M
Create a Home Valuation Report for This Property
The Home Valuation Report is an in-depth analysis detailing your home's value as well as a comparison with similar homes in the area
Home Values in the Area
Average Home Value in this Area
Purchase History
| Date | Buyer | Sale Price | Title Company |
|---|---|---|---|
| Faber Family Trust | -- | None Available | |
| Faber James L | $280,000 | -- | |
| Quinn Perry M | $217,500 | -- | |
| Faber James L | $49,900 | -- | |
| Faber James L | $46,000 | -- |
Source: Public Records
Mortgage History
| Date | Status | Borrower | Loan Amount |
|---|---|---|---|
| Open | Faber James L | $224,000 | |
| Previous Owner | Quinn Perry M | $162,500 |
Source: Public Records
Tax History Compared to Growth
Tax History
| Year | Tax Paid | Tax Assessment Tax Assessment Total Assessment is a certain percentage of the fair market value that is determined by local assessors to be the total taxable value of land and additions on the property. | Land | Improvement |
|---|---|---|---|---|
| 2025 | $10,449 | $115,200 | $88,181 | $27,019 |
| 2024 | $10,449 | $115,200 | $88,181 | $27,019 |
| 2023 | $10,847 | $125,598 | $96,983 | $32,301 |
| 2022 | $9,013 | $97,057 | $70,480 | $26,577 |
| 2021 | $8,595 | $99,850 | $72,508 | $27,342 |
| 2020 | $7,384 | $84,828 | $63,635 | $21,193 |
| 2019 | $7,271 | $84,828 | $63,635 | $21,193 |
| 2018 | $7,000 | $80,734 | $54,000 | $26,734 |
| 2017 | $6,781 | $89,255 | $59,700 | $29,555 |
| 2016 | $5,581 | $64,476 | $43,939 | $20,537 |
| 2015 | $5,285 | $53,332 | $27,860 | $25,472 |
| 2014 | $4,484 | $53,332 | $27,860 | $25,472 |
Source: Public Records
Map
Nearby Homes
- 1023 Forest Ave
- 864 Iris Ave
- 711 Hawthorn Ave
- 3315 Broadway St
- 1070 Juniper Ave
- 3319 Broadway
- 1172 Juniper Ave
- 560 Iris Ave
- 3080 7th St
- 706 Juniper Ave
- 3056 8th St
- 503 Hawthorn Ave
- 1127 Juniper Ave
- 3189 5th St
- 3025 Broadway St Unit 7
- 1237 Elder Ave Unit 1
- 910 Kalmia Ave
- 3345 15th St
- 855 Kalmia Ave
- 2958 6th St