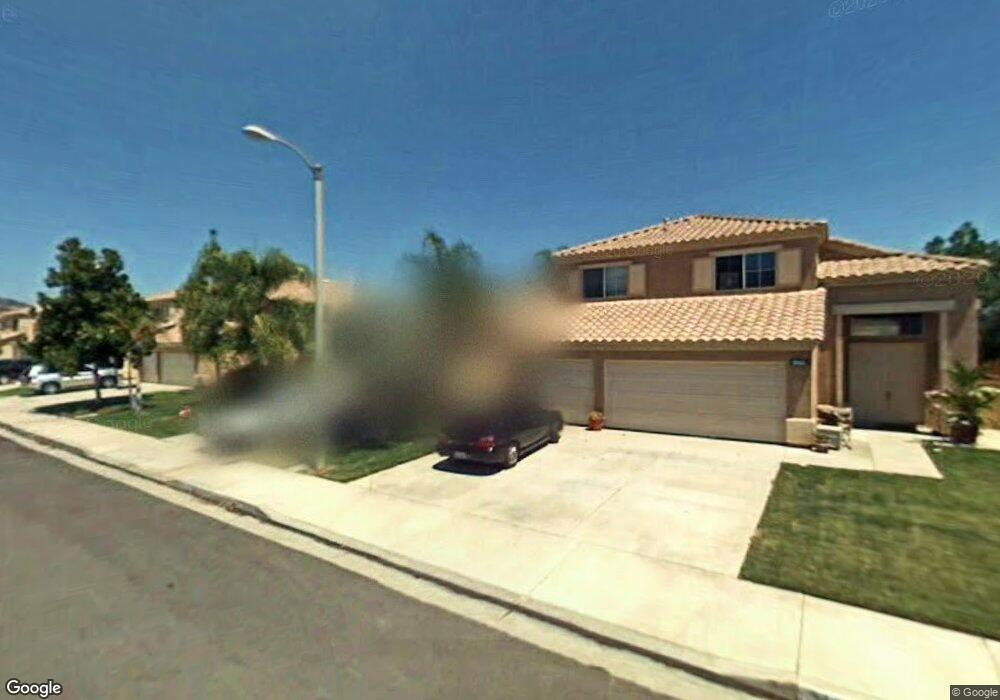
9102 Lantana Dr Corona, CA 92883
Wildrose NeighborhoodEstimated Value: $618,640 - $679,000
3
Beds
2
Baths
1,357
Sq Ft
$474/Sq Ft
Est. Value
About This Home
This home is located at 9102 Lantana Dr, Corona, CA 92883 and is currently estimated at $643,410, approximately $474 per square foot. 9102 Lantana Dr is a home located in Riverside County with nearby schools including Temescal Valley Elementary School, El Cerrito Middle School, and Santiago High School.
Ownership History
Date
Name
Owned For
Owner Type
Purchase Details
Closed on
Mar 23, 2019
Sold by
Robinson Randy D
Bought by
Robinson Christina
Current Estimated Value
Purchase Details
Closed on
Nov 18, 2002
Sold by
Robinson Randy D and Robinson Christina
Bought by
Robinson Randy D
Home Financials for this Owner
Home Financials are based on the most recent Mortgage that was taken out on this home.
Original Mortgage
$87,293
Interest Rate
6.12%
Purchase Details
Closed on
Dec 11, 1997
Sold by
Celli Frank and Celli Parlene A
Bought by
Robinson Randy D
Home Financials for this Owner
Home Financials are based on the most recent Mortgage that was taken out on this home.
Original Mortgage
$92,500
Interest Rate
7.18%
Purchase Details
Closed on
Mar 10, 1994
Sold by
Udc Homes Inc
Bought by
Celli Frank and Celli Parlene A
Home Financials for this Owner
Home Financials are based on the most recent Mortgage that was taken out on this home.
Original Mortgage
$134,800
Interest Rate
7.15%
Create a Home Valuation Report for This Property
The Home Valuation Report is an in-depth analysis detailing your home's value as well as a comparison with similar homes in the area
Home Values in the Area
Average Home Value in this Area
Purchase History
| Date | Buyer | Sale Price | Title Company |
|---|---|---|---|
| Robinson Christina | -- | None Available | |
| Robinson Randy D | -- | Stewart Title | |
| Robinson Randy D | $117,500 | Old Republic Title Company | |
| Celli Frank | $142,000 | Continental Lawyers Title |
Source: Public Records
Mortgage History
| Date | Status | Borrower | Loan Amount |
|---|---|---|---|
| Closed | Robinson Randy D | $87,293 | |
| Previous Owner | Robinson Randy D | $92,500 | |
| Previous Owner | Celli Frank | $134,800 | |
| Closed | Robinson Randy D | $10,000 |
Source: Public Records
Tax History Compared to Growth
Tax History
| Year | Tax Paid | Tax Assessment Tax Assessment Total Assessment is a certain percentage of the fair market value that is determined by local assessors to be the total taxable value of land and additions on the property. | Land | Improvement |
|---|---|---|---|---|
| 2025 | $2,093 | $186,780 | $55,865 | $130,915 |
| 2023 | $2,093 | $179,530 | $53,697 | $125,833 |
| 2022 | $2,027 | $176,011 | $52,645 | $123,366 |
| 2021 | $1,986 | $172,561 | $51,613 | $120,948 |
| 2020 | $1,964 | $170,792 | $51,084 | $119,708 |
| 2019 | $1,841 | $167,444 | $50,083 | $117,361 |
| 2018 | $1,799 | $164,161 | $49,101 | $115,060 |
| 2017 | $1,754 | $160,943 | $48,139 | $112,804 |
| 2016 | $1,736 | $157,789 | $47,196 | $110,593 |
| 2015 | $1,698 | $155,421 | $46,488 | $108,933 |
| 2014 | $1,635 | $152,378 | $45,578 | $106,800 |
Source: Public Records
Map
Nearby Homes
- 8851 Soothing Ct
- 19980 Temescal Canyon Rd
- 9121 Gold Fields Cir
- 8824 Soothing Ct
- 8832 Gentle Wind Dr
- 22810 Mountain Ash Cir
- 22905 Canyon View Dr
- 22801 Hannah Ct
- 8863 Crest View Dr
- 8550 Rolling Hills Dr
- 9387 Hot Springs Rd
- 8335 Sunset Rose Dr
- 8365 Sanctuary Dr
- 8337 Sanctuary Dr
- 23375 Toronja Corte
- 0 Knabe Rd
- 8287 Soft Winds Dr
- 8341 Kiley Ct
- 8656 Calle Canon Rd
- 8628 Calle Canon Rd
- 9116 Lantana Dr
- 9088 Lantana Dr
- 9099 Desert Acacia Ln
- 9130 Lantana Dr
- 9074 Lantana Dr
- 9083 Desert Acacia Ln
- 9115 Desert Acacia Ln
- 9067 Desert Acacia Ln
- 9131 Desert Acacia Ln
- 9144 Lantana Dr
- 9060 Lantana Dr
- 9093 Lantana Dr
- 9107 Lantana Dr
- 9079 Lantana Dr
- 9059 Desert Acacia Ln
- 9121 Lantana Dr
- 9065 Lantana Dr
- 9147 Desert Acacia Ln
- 9046 Lantana Dr
- 9158 Lantana Dr