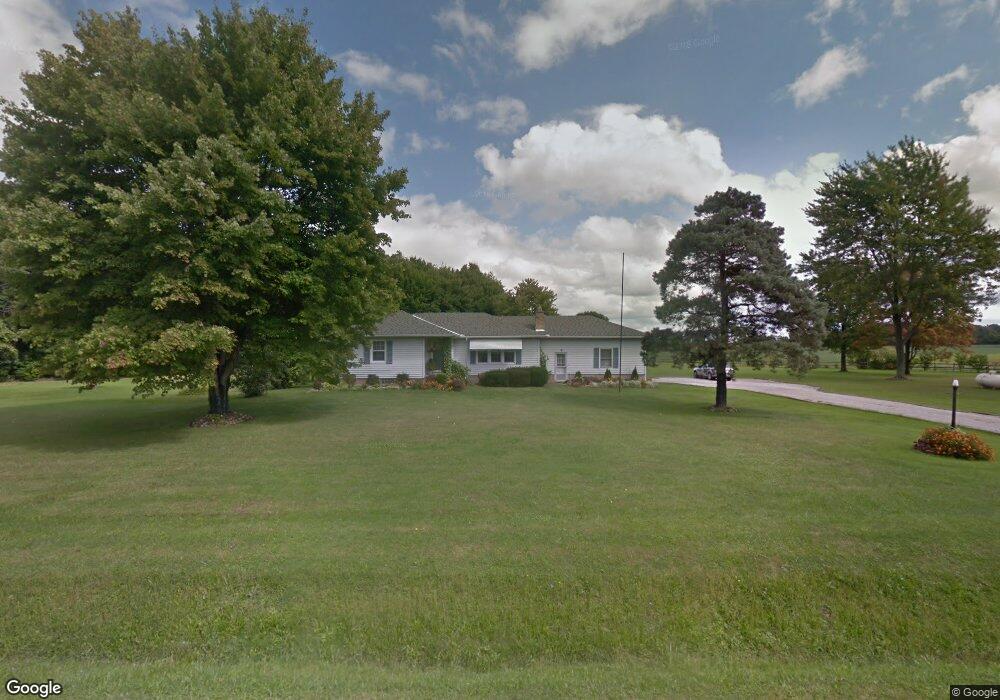
9109 Gifford Rd Amherst, OH 44001
Estimated Value: $292,000 - $339,000
3
Beds
2
Baths
1,402
Sq Ft
$223/Sq Ft
Est. Value
About This Home
This home is located at 9109 Gifford Rd, Amherst, OH 44001 and is currently estimated at $312,212, approximately $222 per square foot. 9109 Gifford Rd is a home located in Lorain County with nearby schools including Firelands Elementary School, Firelands Middle School, and Firelands High School.
Ownership History
Date
Name
Owned For
Owner Type
Purchase Details
Closed on
Jan 22, 2020
Sold by
Stock Dennis and Stock Jean A
Bought by
Stock Dennis and Stock Jean A
Current Estimated Value
Purchase Details
Closed on
Apr 21, 2015
Sold by
Stock Dennis and Stock Jean A
Bought by
Stock Dennis and Stock Jean A
Home Financials for this Owner
Home Financials are based on the most recent Mortgage that was taken out on this home.
Original Mortgage
$91,200
Interest Rate
3.85%
Mortgage Type
New Conventional
Purchase Details
Closed on
Jul 24, 1999
Sold by
Wilmoth Raymond E and Wilmoth Clara D
Bought by
Stock Dennis and Stock Jean A
Home Financials for this Owner
Home Financials are based on the most recent Mortgage that was taken out on this home.
Original Mortgage
$123,200
Interest Rate
7.69%
Purchase Details
Closed on
Sep 25, 1998
Sold by
Mann Emma J
Bought by
Wilmoth Raymond J and Wilmoth Clara D
Home Financials for this Owner
Home Financials are based on the most recent Mortgage that was taken out on this home.
Original Mortgage
$127,200
Interest Rate
6.99%
Create a Home Valuation Report for This Property
The Home Valuation Report is an in-depth analysis detailing your home's value as well as a comparison with similar homes in the area
Home Values in the Area
Average Home Value in this Area
Purchase History
| Date | Buyer | Sale Price | Title Company |
|---|---|---|---|
| Stock Dennis | -- | None Available | |
| Stock Dennis | -- | First American Title Ins Co | |
| Stock Dennis | $154,000 | Midland Title | |
| Wilmoth Raymond J | $159,000 | Midland Title |
Source: Public Records
Mortgage History
| Date | Status | Borrower | Loan Amount |
|---|---|---|---|
| Closed | Stock Dennis | $91,200 | |
| Closed | Stock Dennis | $123,200 | |
| Closed | Wilmoth Raymond J | $127,200 |
Source: Public Records
Tax History Compared to Growth
Tax History
| Year | Tax Paid | Tax Assessment Tax Assessment Total Assessment is a certain percentage of the fair market value that is determined by local assessors to be the total taxable value of land and additions on the property. | Land | Improvement |
|---|---|---|---|---|
| 2024 | $3,467 | $93,373 | $32,211 | $61,163 |
| 2023 | $2,600 | $65,027 | $18,834 | $46,193 |
| 2022 | $2,575 | $65,027 | $18,834 | $46,193 |
| 2021 | $2,573 | $65,027 | $18,834 | $46,193 |
| 2020 | $2,291 | $56,410 | $16,340 | $40,070 |
| 2019 | $2,274 | $56,410 | $16,340 | $40,070 |
| 2018 | $2,331 | $56,410 | $16,340 | $40,070 |
| 2017 | $2,255 | $56,500 | $17,620 | $38,880 |
| 2016 | $2,283 | $56,500 | $17,620 | $38,880 |
| 2015 | $2,285 | $56,500 | $17,620 | $38,880 |
| 2014 | -- | $56,500 | $17,620 | $38,880 |
| 2013 | $2,225 | $56,500 | $17,620 | $38,880 |
Source: Public Records
Map
Nearby Homes
- 9839 Gifford Rd
- Lot B Gifford Rd
- 48375 Telegraph Rd
- 402 Church St
- 7720 Rice Rd
- 401 Leonard St
- 314 Fern St
- 48221 Rice Rd
- 2250 Claus Rd
- 11135 Baumhart Rd
- 2745 Cooper Foster Park Rd
- 9113 Dean Rd
- 671 S Lake St
- 49215 Whittlesey Rd
- 198 Oakdale Dr
- 6429 Russia Rd
- 311 Oak St Unit 311
- 323 Westwoods
- 658 Nicole Dr
- 8030 Pyle South Amherst Rd
- 9106 Gifford Rd
- 9185 Gifford Rd
- 9100 Gifford Rd
- 9150 Gifford Rd
- 9224 Gifford Rd
- 9054 Gifford Rd
- 9028 Gifford Rd
- 9221 Vermilion Rd
- 9312 Gifford Rd
- 8967 Gifford Rd
- 9091 Vermilion Rd
- 9275 Vermilion Rd
- 9000 Gifford Rd
- 8959 Gifford Rd
- 9293 Vermilion Rd
- 9307 Vermilion Rd
- 8952 Gifford Rd
- 9360 Gifford Rd
- 8931 Gifford Rd
- 9064 Vermilion Rd