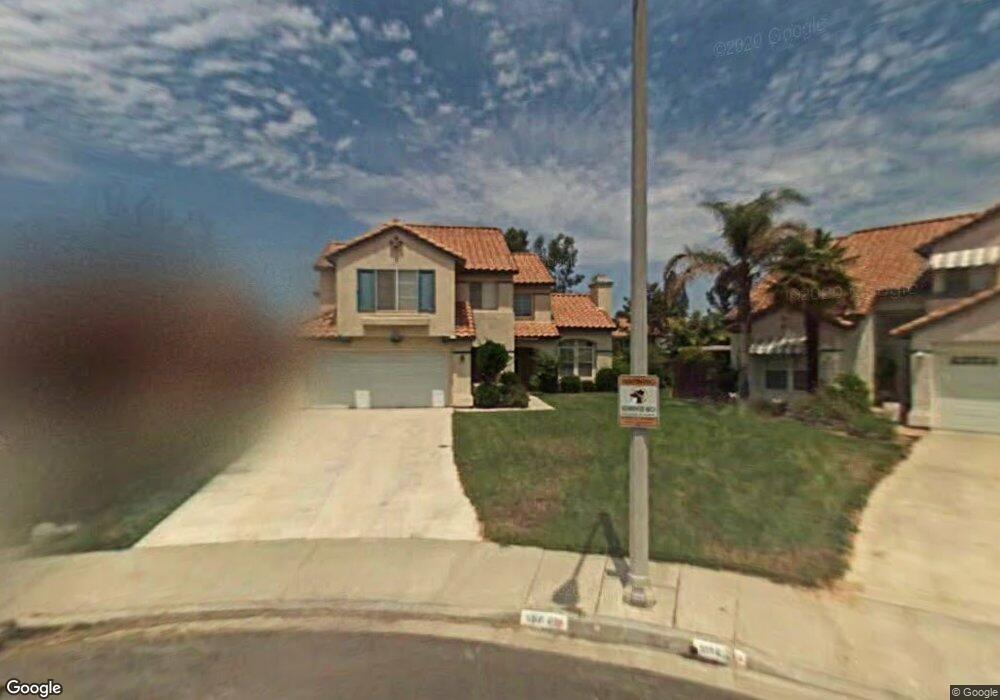
9117 Rangpur Cir Riverside, CA 92508
Orangecrest NeighborhoodEstimated Value: $577,000 - $725,000
4
Beds
3
Baths
1,840
Sq Ft
$361/Sq Ft
Est. Value
About This Home
This home is located at 9117 Rangpur Cir, Riverside, CA 92508 and is currently estimated at $664,488, approximately $361 per square foot. 9117 Rangpur Cir is a home located in Riverside County with nearby schools including Mark Twain Elementary School, Frank Augustus Miller Middle School, and Martin Luther King Junior High School.
Ownership History
Date
Name
Owned For
Owner Type
Purchase Details
Closed on
Jun 24, 2003
Sold by
Prudential Residential Services Lp
Bought by
Webb Portia J
Current Estimated Value
Home Financials for this Owner
Home Financials are based on the most recent Mortgage that was taken out on this home.
Original Mortgage
$224,000
Outstanding Balance
$88,042
Interest Rate
4.37%
Mortgage Type
Purchase Money Mortgage
Estimated Equity
$576,446
Purchase Details
Closed on
Jun 13, 2003
Sold by
Gate Christopher T and Gate Sharon D
Bought by
Prudential Residential Services Lp
Home Financials for this Owner
Home Financials are based on the most recent Mortgage that was taken out on this home.
Original Mortgage
$224,000
Outstanding Balance
$88,042
Interest Rate
4.37%
Mortgage Type
Purchase Money Mortgage
Estimated Equity
$576,446
Purchase Details
Closed on
Apr 6, 1998
Sold by
Gate Tom and Gate Margaret
Bought by
Gate Christopher T and Gate Sharon D
Purchase Details
Closed on
Sep 15, 1997
Sold by
Kim Dae Y and Kim Ki S
Bought by
Gate Tom and Gate Margaret
Create a Home Valuation Report for This Property
The Home Valuation Report is an in-depth analysis detailing your home's value as well as a comparison with similar homes in the area
Home Values in the Area
Average Home Value in this Area
Purchase History
| Date | Buyer | Sale Price | Title Company |
|---|---|---|---|
| Webb Portia J | $280,000 | Fnt | |
| Prudential Residential Services Lp | $280,000 | Fnt | |
| Gate Christopher T | -- | -- | |
| Gate Tom | $136,000 | First American Title Ins Co |
Source: Public Records
Mortgage History
| Date | Status | Borrower | Loan Amount |
|---|---|---|---|
| Open | Webb Portia J | $224,000 | |
| Closed | Webb Portia J | $56,000 |
Source: Public Records
Tax History
| Year | Tax Paid | Tax Assessment Tax Assessment Total Assessment is a certain percentage of the fair market value that is determined by local assessors to be the total taxable value of land and additions on the property. | Land | Improvement |
|---|---|---|---|---|
| 2025 | $4,327 | $398,072 | $92,402 | $305,670 |
| 2023 | $4,327 | $382,616 | $88,815 | $293,801 |
| 2022 | $4,229 | $375,115 | $87,074 | $288,041 |
| 2021 | $4,175 | $367,761 | $85,367 | $282,394 |
| 2020 | $4,144 | $363,991 | $84,492 | $279,499 |
| 2019 | $4,066 | $356,855 | $82,836 | $274,019 |
| 2018 | $3,987 | $349,859 | $81,212 | $268,647 |
| 2017 | $3,917 | $343,000 | $79,620 | $263,380 |
| 2016 | $3,666 | $336,275 | $78,059 | $258,216 |
| 2015 | $3,614 | $331,227 | $76,888 | $254,339 |
| 2014 | $3,414 | $303,000 | $70,000 | $233,000 |
Source: Public Records
Map
Nearby Homes
- 9146 Rangpur Cir
- 9131 Santa Barbara Dr
- 9036 Limecrest Dr
- 19540 Chinotto Ln
- 0 Apn#267-180-003 Unit CV22145370
- 0 Old Frontage Rd Unit OC25137111
- 19911 Westerly Dr
- 19971 Westerly Dr
- 19320 Totem Ct
- 19791 Paso Robles Dr
- 19972 Windwood Cir
- 8634 Cabin Place
- 9334 Meadow Ln
- 9549 Calico Trail
- 9610 Babaco St
- 9611 Babaco St
- 9618 Babaco St
- 9619 Babaco St
- 8470 Lindenhurst St
- 8449 Monique Ct
- 9123 Rangpur Cir
- 9116 Rangpur Cir
- 19629 Kinnow Ln
- 19639 Kinnow Ln
- 9129 Rangpur Cir
- 19619 Kinnow Ln
- 9122 Rangpur Cir
- 19609 Kinnow Ln
- 9130 Shaddock Cir
- 9135 Rangpur Cir
- 19649 Kinnow Ln
- 9128 Rangpur Cir
- 9136 Shaddock Cir
- 19563 Kinnow Ln
- 9141 Rangpur Cir
- 9134 Rangpur Cir
- 9124 Shaddock Cir
- 9142 Shaddock Cir
- 9115 Limecrest Dr
- 9109 Limecrest Dr
Your Personal Tour Guide
Ask me questions while you tour the home.