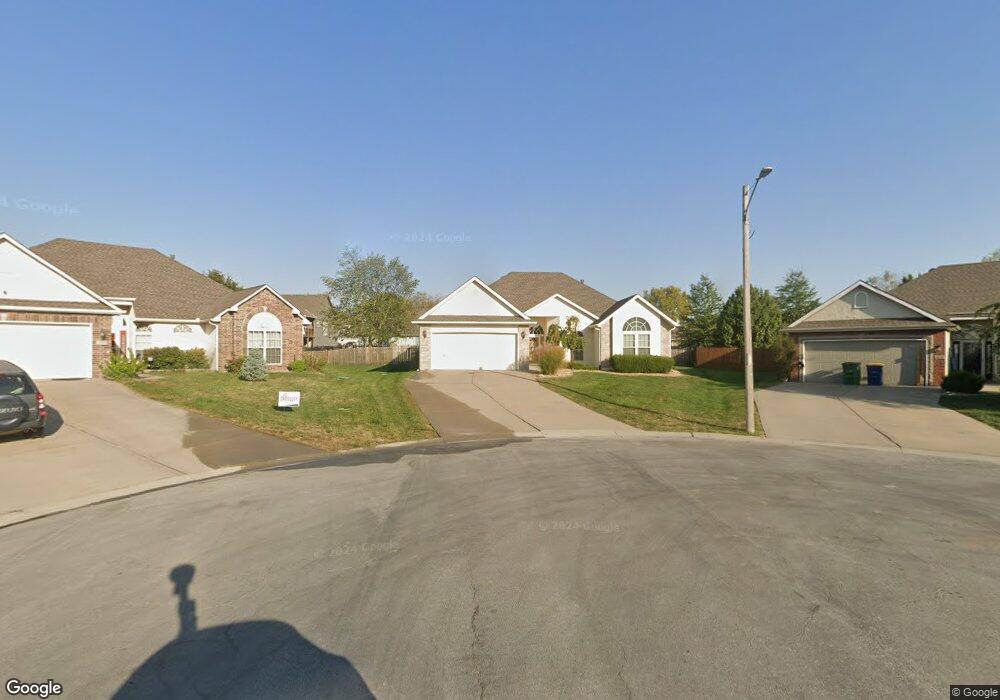
913 SE Hocker Cir Lees Summit, MO 64081
Estimated Value: $311,000 - $363,000
3
Beds
2
Baths
1,703
Sq Ft
$200/Sq Ft
Est. Value
About This Home
This home is located at 913 SE Hocker Cir, Lees Summit, MO 64081 and is currently estimated at $341,122, approximately $200 per square foot. 913 SE Hocker Cir is a home located in Jackson County with nearby schools including Sunset Valley Elementary School, Pleasant Lea Middle School, and Lee's Summit Senior High School.
Ownership History
Date
Name
Owned For
Owner Type
Purchase Details
Closed on
Dec 8, 2011
Sold by
Owen Candes L
Bought by
Owen Candes L and The Candes L Owen Trust
Current Estimated Value
Home Financials for this Owner
Home Financials are based on the most recent Mortgage that was taken out on this home.
Original Mortgage
$38,641
Outstanding Balance
$4,011
Interest Rate
3.35%
Mortgage Type
New Conventional
Estimated Equity
$337,111
Purchase Details
Closed on
Mar 13, 2007
Sold by
Owen Candes L
Bought by
Owen Candes L and Candes L Owen Trust
Purchase Details
Closed on
Nov 5, 2002
Sold by
Clear Mountain Properties Llc
Bought by
James Ray Builders Inc
Home Financials for this Owner
Home Financials are based on the most recent Mortgage that was taken out on this home.
Original Mortgage
$132,800
Outstanding Balance
$55,337
Interest Rate
5.95%
Mortgage Type
Construction
Estimated Equity
$285,785
Create a Home Valuation Report for This Property
The Home Valuation Report is an in-depth analysis detailing your home's value as well as a comparison with similar homes in the area
Home Values in the Area
Average Home Value in this Area
Purchase History
| Date | Buyer | Sale Price | Title Company |
|---|---|---|---|
| Owen Candes L | -- | None Available | |
| Owen Candes L | -- | None Available | |
| Owen Candes L | -- | None Available | |
| James Ray Builders Inc | -- | Coffelt Land Title Inc |
Source: Public Records
Mortgage History
| Date | Status | Borrower | Loan Amount |
|---|---|---|---|
| Open | Owen Candes L | $38,641 | |
| Open | James Ray Builders Inc | $132,800 |
Source: Public Records
Tax History Compared to Growth
Tax History
| Year | Tax Paid | Tax Assessment Tax Assessment Total Assessment is a certain percentage of the fair market value that is determined by local assessors to be the total taxable value of land and additions on the property. | Land | Improvement |
|---|---|---|---|---|
| 2025 | $3,168 | $50,449 | $9,156 | $41,293 |
| 2024 | $3,458 | $43,869 | $7,952 | $35,917 |
| 2023 | $3,458 | $48,239 | $8,267 | $39,972 |
| 2022 | $3,298 | $40,850 | $9,814 | $31,036 |
| 2021 | $3,366 | $40,850 | $9,814 | $31,036 |
| 2020 | $3,241 | $38,951 | $9,814 | $29,137 |
| 2019 | $3,483 | $43,033 | $9,814 | $33,219 |
| 2018 | $3,229 | $37,025 | $4,439 | $32,586 |
| 2017 | $3,229 | $37,025 | $4,439 | $32,586 |
| 2016 | $3,008 | $34,143 | $6,251 | $27,892 |
| 2014 | $2,761 | $30,723 | $6,238 | $24,485 |
Source: Public Records
Map
Nearby Homes
- 1624 SE Dalton Dr
- 1436 SE Newberry Place
- 1130 SE Ranchland St
- 1131 SE Ranchland St
- 707 SE 14th St
- 1412 SE Lexington Ave
- 1407 SE Norwood Dr
- 1335 SE Lexington Ave Unit C
- Winfield Plan at Bailey Farms
- Twin Wildflower Plan at Bailey Farms
- Twin Tupelo Plan at Bailey Farms
- Sunflower Plan at Bailey Farms
- Somerset Plan at Bailey Farms
- Sienna Plan at Bailey Farms
- Sheffield Plan at Bailey Farms
- Saffron Plan at Bailey Farms
- Riverside Plan at Bailey Farms
- Honeydew Plan at Bailey Farms
- Wildflower Plan at Bailey Farms
- Tupelo Plan at Bailey Farms
- 909 SE Hocker Cir
- 908 SE Hocker Cir
- 1608 SE Dalton Dr
- 1604 SE Dalton Dr
- 904 SE Hocker Cir
- 905 SE Hocker Cir
- 1612 SE Dalton Dr
- 1600 SE Dalton Dr
- 1616 SE Dalton Dr
- 900 SE Hocker Cir
- 1609 SE Hocker St
- 1628 SE Dalton Dr
- 1620 SE Dalton Dr
- 1613 SE Hocker St
- 1609 SE Dalton Dr
- 1605 SE Dalton Dr
- 1613 SE Dalton Dr
- 1520 SE Dalton Dr
- 1601 SE Dalton Dr
- 1617 SE Hocker St