Estimated Value: $485,000 - $535,140
3
Beds
2
Baths
1,436
Sq Ft
$360/Sq Ft
Est. Value
About This Home
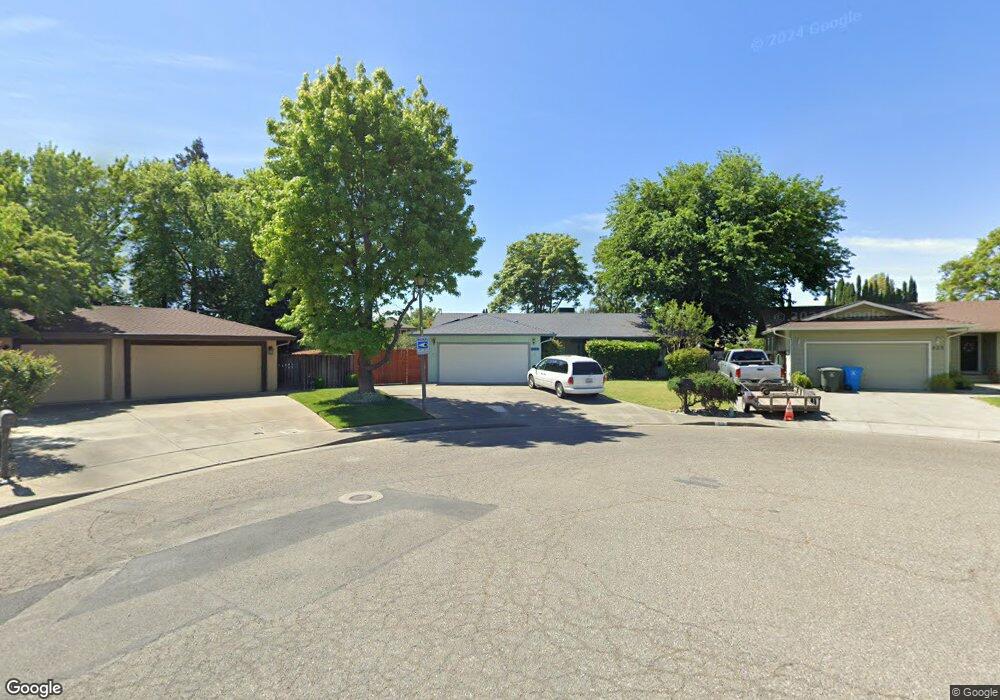
This home is located at 915 Mason Ct, Dixon, CA 95620 and is currently estimated at $517,035, approximately $360 per square foot. 915 Mason Ct is a home located in Solano County with nearby schools including Gretchen Higgins Elementary School, Dixon High School, and Dixon Montessori Charter.
Ownership History
Date
Name
Owned For
Owner Type
Purchase Details
Closed on
Oct 18, 2002
Sold by
Lucchesi Leo A and Lucchesi Charlotte
Bought by
Armstrong David R and Armstrong Donna
Current Estimated Value
Home Financials for this Owner
Home Financials are based on the most recent Mortgage that was taken out on this home.
Original Mortgage
$195,500
Outstanding Balance
$80,942
Interest Rate
5.99%
Estimated Equity
$436,093
Purchase Details
Closed on
May 24, 1999
Sold by
Dowling Daniel K
Bought by
Lucchesi Leo A and Lucchesi Charlotte
Home Financials for this Owner
Home Financials are based on the most recent Mortgage that was taken out on this home.
Original Mortgage
$127,075
Interest Rate
6.86%
Purchase Details
Closed on
May 9, 1996
Sold by
Gojkovich Gordon and Stossel Jennie
Bought by
Dowling Daniel K
Home Financials for this Owner
Home Financials are based on the most recent Mortgage that was taken out on this home.
Original Mortgage
$96,000
Interest Rate
7.8%
Create a Home Valuation Report for This Property
The Home Valuation Report is an in-depth analysis detailing your home's value as well as a comparison with similar homes in the area
Home Values in the Area
Average Home Value in this Area
Purchase History
| Date | Buyer | Sale Price | Title Company |
|---|---|---|---|
| Armstrong David R | $270,500 | Chicago Title Company | |
| Lucchesi Leo A | $149,500 | Fidelity National Title Co | |
| Dowling Daniel K | $120,000 | Placer Title Company |
Source: Public Records
Mortgage History
| Date | Status | Borrower | Loan Amount |
|---|---|---|---|
| Open | Armstrong David R | $195,500 | |
| Previous Owner | Lucchesi Leo A | $127,075 | |
| Previous Owner | Dowling Daniel K | $96,000 |
Source: Public Records
Tax History
| Year | Tax Paid | Tax Assessment Tax Assessment Total Assessment is a certain percentage of the fair market value that is determined by local assessors to be the total taxable value of land and additions on the property. | Land | Improvement |
|---|---|---|---|---|
| 2025 | $6,310 | $391,763 | $94,136 | $297,627 |
| 2024 | $6,310 | $384,083 | $92,291 | $291,792 |
| 2023 | $6,179 | $376,553 | $90,482 | $286,071 |
| 2022 | $6,115 | $369,170 | $88,708 | $280,462 |
| 2021 | $6,061 | $361,932 | $86,969 | $274,963 |
| 2020 | $5,948 | $358,222 | $86,078 | $272,144 |
| 2019 | $5,870 | $351,199 | $84,391 | $266,808 |
| 2018 | $5,847 | $344,314 | $82,737 | $261,577 |
| 2017 | $3,898 | $337,564 | $81,115 | $256,449 |
| 2016 | $3,729 | $330,946 | $79,525 | $251,421 |
| 2015 | $3,378 | $304,000 | $64,000 | $240,000 |
| 2014 | $2,816 | $252,000 | $55,000 | $197,000 |
Source: Public Records
Map
Nearby Homes
- 775 Cahill Ct
- 550 N Lincoln St
- 795 Michele Ct
- 905 W F St
- 1135 Dawson Dr
- 1315 Jacobs Place
- 1365 Jacobs Place
- 630 Sierra Dr
- 1320 Angela Ct
- 660 Berkshire Dr
- 610 Sierra Dr
- 535 Amesbury Dr
- 650 W C St
- 1150 Mulberry Ln
- 730 Stratford Ave
- 689 W C St
- 1155 Mulberry Ln
- 1250 Redwood Ct
- 1825 Whiting Ct
- 690 Woodard Way
Your Personal Tour Guide
Ask me questions while you tour the home.