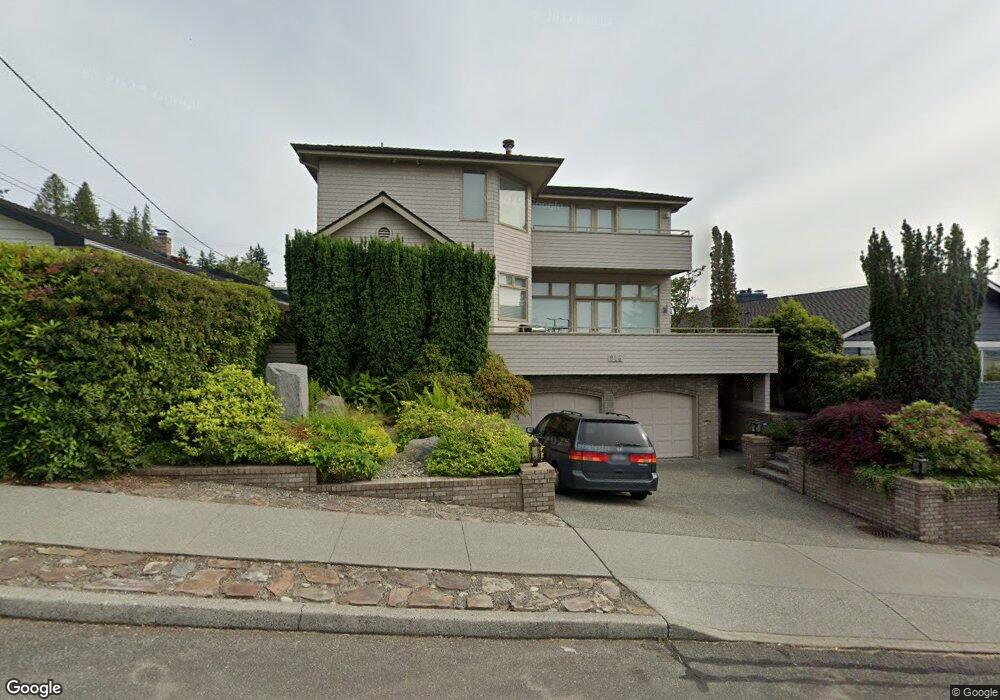
916 Alder St Edmonds, WA 98020
Westgate NeighborhoodEstimated Value: $2,208,922 - $2,679,000
3
Beds
4
Baths
3,800
Sq Ft
$652/Sq Ft
Est. Value
About This Home
This home is located at 916 Alder St, Edmonds, WA 98020 and is currently estimated at $2,476,731, approximately $651 per square foot. 916 Alder St is a home located in Snohomish County with nearby schools including Westgate Elementary School, College Place Middle School, and Edmonds-Woodway High School.
Ownership History
Date
Name
Owned For
Owner Type
Purchase Details
Closed on
Mar 11, 2024
Sold by
Petre Rebecca J
Bought by
Rebecca J Petre Family Trust and Petre
Current Estimated Value
Purchase Details
Closed on
Feb 15, 2006
Sold by
Mackenzie Delmar and Mackenzie Christine E
Bought by
Petre Rebeeca J
Home Financials for this Owner
Home Financials are based on the most recent Mortgage that was taken out on this home.
Original Mortgage
$750,000
Interest Rate
5.35%
Mortgage Type
Fannie Mae Freddie Mac
Purchase Details
Closed on
Jul 7, 2003
Sold by
Clos Robert B and Clos Carol M
Bought by
Mackenzie Delmar and Mackenzie Christine E
Home Financials for this Owner
Home Financials are based on the most recent Mortgage that was taken out on this home.
Original Mortgage
$650,000
Interest Rate
5.18%
Mortgage Type
Purchase Money Mortgage
Create a Home Valuation Report for This Property
The Home Valuation Report is an in-depth analysis detailing your home's value as well as a comparison with similar homes in the area
Home Values in the Area
Average Home Value in this Area
Purchase History
| Date | Buyer | Sale Price | Title Company |
|---|---|---|---|
| Rebecca J Petre Family Trust | $313 | None Listed On Document | |
| Petre Rebeeca J | $1,200,000 | Rainier Title | |
| Mackenzie Delmar | $850,000 | First American |
Source: Public Records
Mortgage History
| Date | Status | Borrower | Loan Amount |
|---|---|---|---|
| Previous Owner | Petre Rebeeca J | $750,000 | |
| Previous Owner | Mackenzie Delmar | $650,000 | |
| Closed | Mackenzie Delmar | $115,000 |
Source: Public Records
Tax History Compared to Growth
Tax History
| Year | Tax Paid | Tax Assessment Tax Assessment Total Assessment is a certain percentage of the fair market value that is determined by local assessors to be the total taxable value of land and additions on the property. | Land | Improvement |
|---|---|---|---|---|
| 2025 | $13,545 | $1,918,000 | $1,181,800 | $736,200 |
| 2024 | $13,545 | $1,903,800 | $1,202,700 | $701,100 |
| 2023 | $13,932 | $2,029,100 | $1,236,900 | $792,200 |
| 2022 | $14,176 | $1,697,400 | $1,007,700 | $689,700 |
| 2020 | $12,234 | $1,310,100 | $753,300 | $556,800 |
| 2019 | $11,433 | $1,233,200 | $700,000 | $533,200 |
| 2018 | $11,928 | $1,111,600 | $633,800 | $477,800 |
| 2017 | $10,439 | $1,017,900 | $573,000 | $444,900 |
| 2016 | $9,162 | $885,100 | $454,000 | $431,100 |
| 2015 | $9,241 | $840,600 | $398,400 | $442,200 |
| 2013 | $7,731 | $663,200 | $300,500 | $362,700 |
Source: Public Records
Map
Nearby Homes
- 816 Walnut St
- 1021 Walnut St
- 9533 Bowdoin Way
- 302 6th Ave S
- 21232 92nd Place W
- 21703 97th Ave W
- 621 Daley St
- 603 7th Ave N Unit A306
- 609 7th Ave N Unit B204
- 960 5th Ave S Unit 208
- 335 3rd Ave S Unit 203
- 1221 Coronado Place
- 233 3rd Ave S Unit 304
- 22039 98th Place W
- 8804 209th Place SW
- 637 Elm Place
- 625 Aloha Way
- 8732 209th Place SW
- 1071 4th Ave S Unit 302
- 1110 5th Ave S Unit 204