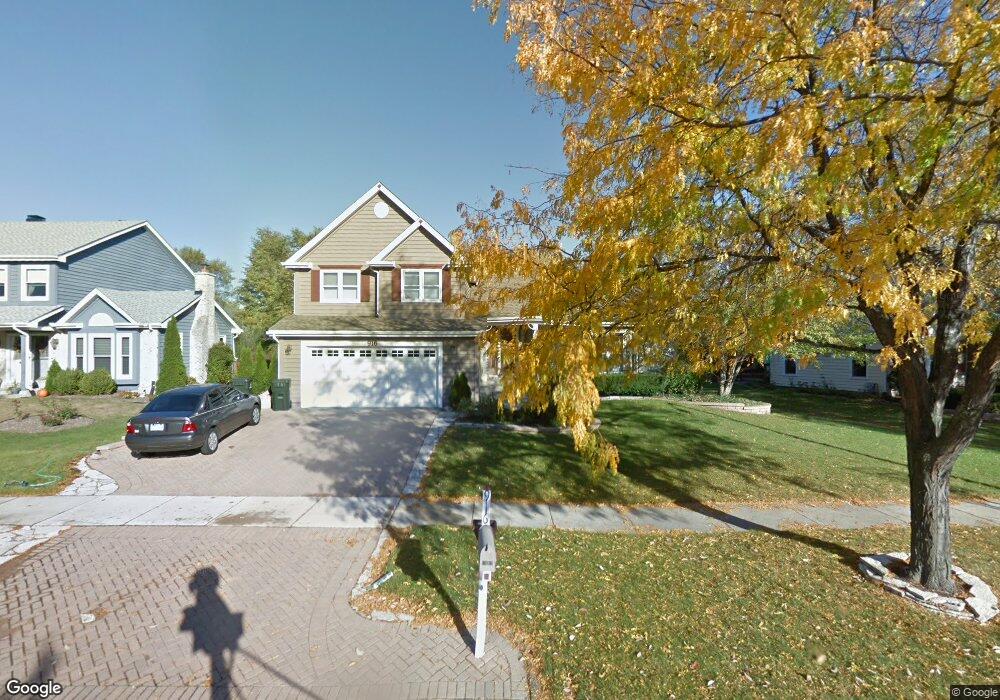
916 Elm St Naperville, IL 60540
West Wind NeighborhoodEstimated Value: $612,000 - $807,000
3
Beds
3
Baths
2,163
Sq Ft
$313/Sq Ft
Est. Value
About This Home
This home is located at 916 Elm St, Naperville, IL 60540 and is currently estimated at $677,646, approximately $313 per square foot. 916 Elm St is a home located in DuPage County with nearby schools including May Watts Elementary School, Charlestown Middle School, and Thayer J. Hill Middle School.
Ownership History
Date
Name
Owned For
Owner Type
Purchase Details
Closed on
Jan 16, 2012
Sold by
Scupin Robert J and Scupin Deborah L
Bought by
Kolodzej Matthew S and Kolodzej Lynette
Current Estimated Value
Home Financials for this Owner
Home Financials are based on the most recent Mortgage that was taken out on this home.
Original Mortgage
$294,831
Outstanding Balance
$199,891
Interest Rate
3.75%
Mortgage Type
FHA
Estimated Equity
$477,755
Purchase Details
Closed on
May 8, 1996
Sold by
Michalski Robert E and Michalski Deborah A
Bought by
Scupin Robert J and Scupin Deborah L
Home Financials for this Owner
Home Financials are based on the most recent Mortgage that was taken out on this home.
Original Mortgage
$107,400
Interest Rate
8.33%
Create a Home Valuation Report for This Property
The Home Valuation Report is an in-depth analysis detailing your home's value as well as a comparison with similar homes in the area
Home Values in the Area
Average Home Value in this Area
Purchase History
| Date | Buyer | Sale Price | Title Company |
|---|---|---|---|
| Kolodzej Matthew S | $302,500 | First American Title Ins Co | |
| Scupin Robert J | $207,000 | Attorneys Title Guaranty Fun |
Source: Public Records
Mortgage History
| Date | Status | Borrower | Loan Amount |
|---|---|---|---|
| Open | Kolodzej Matthew S | $294,831 | |
| Previous Owner | Scupin Robert J | $107,400 | |
| Closed | Scupin Robert J | $100,000 |
Source: Public Records
Tax History Compared to Growth
Tax History
| Year | Tax Paid | Tax Assessment Tax Assessment Total Assessment is a certain percentage of the fair market value that is determined by local assessors to be the total taxable value of land and additions on the property. | Land | Improvement |
|---|---|---|---|---|
| 2024 | $10,133 | $170,340 | $50,247 | $120,093 |
| 2023 | $9,699 | $153,060 | $45,150 | $107,910 |
| 2022 | $9,407 | $143,650 | $42,130 | $101,520 |
| 2021 | $6,709 | $138,530 | $40,630 | $97,900 |
| 2020 | $9,097 | $138,530 | $40,630 | $97,900 |
| 2019 | $6,709 | $102,560 | $38,640 | $63,920 |
| 2018 | $3,867 | $60,630 | $37,390 | $23,240 |
| 2017 | $8,370 | $123,290 | $36,120 | $87,170 |
| 2016 | $8,216 | $118,320 | $34,660 | $83,660 |
| 2015 | $7,942 | $112,340 | $32,910 | $79,430 |
| 2014 | $7,475 | $102,900 | $30,430 | $72,470 |
| 2013 | $7,458 | $103,610 | $30,640 | $72,970 |
Source: Public Records
Map
Nearby Homes
- 1262 Rhodes Ln Unit 2701
- 1208 Tennyson Ln
- 1114 Tennyson Ln
- 1259 Natchez Trace Cir
- 7S410 Arbor Dr
- 856 Cardiff Rd
- 1033 Emerald Dr
- 891 Lowell Ln
- 316 Hemlock Ln
- 225 Elmwood Dr
- 845 Tulip Ln
- 2459 Emerson Ln
- 132 Robin Hill Dr
- 319 Claremont Ct
- 480 Village Green Rd
- 425 W Gartner Rd
- 479 River Bend Rd Unit 111
- 417 River Bluff Cir
- 2508 Carrolwood Rd Unit 13
- 822 Shandrew Dr Unit 103