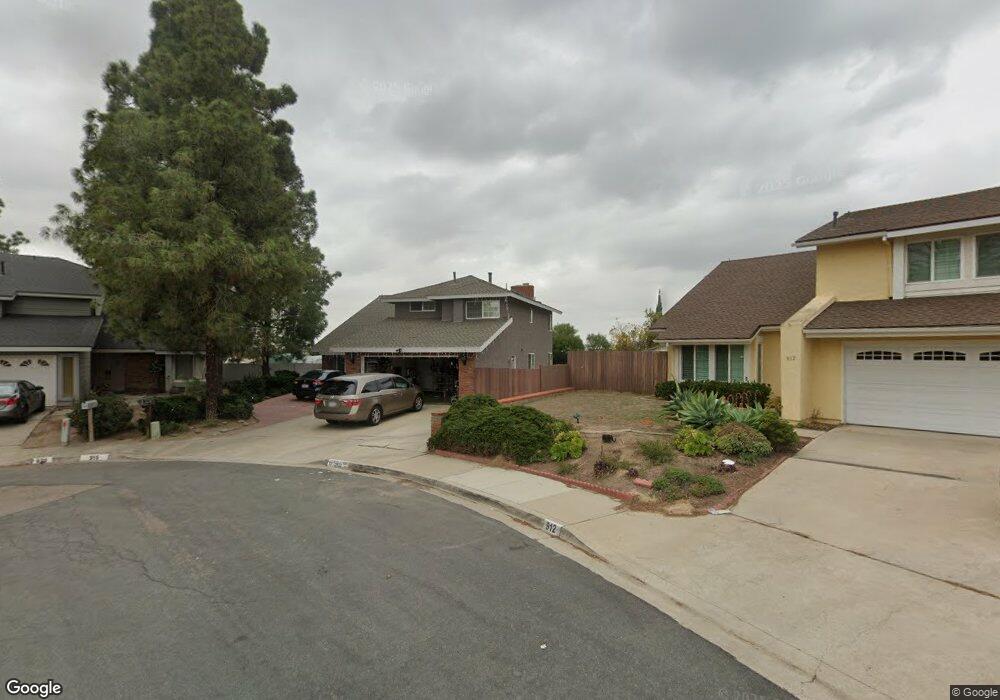
916 Mesa Ct Chula Vista, CA 91910
Rancho Del Rey NeighborhoodEstimated Value: $1,008,582 - $1,040,000
4
Beds
3
Baths
2,293
Sq Ft
$447/Sq Ft
Est. Value
About This Home
This home is located at 916 Mesa Ct, Chula Vista, CA 91910 and is currently estimated at $1,025,146, approximately $447 per square foot. 916 Mesa Ct is a home located in San Diego County with nearby schools including Halecrest Elementary School, Hilltop Middle School, and Hilltop Senior High School.
Ownership History
Date
Name
Owned For
Owner Type
Purchase Details
Closed on
Feb 18, 1997
Sold by
Gersten Virginia H
Bought by
Centeno Richard M and Garcia Centeno Marisela S
Current Estimated Value
Home Financials for this Owner
Home Financials are based on the most recent Mortgage that was taken out on this home.
Original Mortgage
$97,600
Outstanding Balance
$11,283
Interest Rate
7.81%
Estimated Equity
$1,013,863
Purchase Details
Closed on
Apr 26, 1996
Sold by
Gersten Virginia H
Bought by
Gersten Virginia Hellen
Create a Home Valuation Report for This Property
The Home Valuation Report is an in-depth analysis detailing your home's value as well as a comparison with similar homes in the area
Home Values in the Area
Average Home Value in this Area
Purchase History
| Date | Buyer | Sale Price | Title Company |
|---|---|---|---|
| Centeno Richard M | $208,000 | Guardian Title Company | |
| Gersten Virginia Hellen | -- | -- |
Source: Public Records
Mortgage History
| Date | Status | Borrower | Loan Amount |
|---|---|---|---|
| Open | Centeno Richard M | $97,600 |
Source: Public Records
Tax History
| Year | Tax Paid | Tax Assessment Tax Assessment Total Assessment is a certain percentage of the fair market value that is determined by local assessors to be the total taxable value of land and additions on the property. | Land | Improvement |
|---|---|---|---|---|
| 2025 | $4,164 | $336,378 | $87,289 | $249,089 |
| 2024 | $4,164 | $339,783 | $85,578 | $254,205 |
| 2023 | $4,100 | $333,121 | $83,900 | $249,221 |
| 2022 | $3,979 | $326,590 | $82,255 | $244,335 |
| 2021 | $3,889 | $320,188 | $80,643 | $239,545 |
| 2020 | $3,798 | $316,906 | $79,817 | $237,089 |
| 2019 | $3,699 | $310,693 | $78,252 | $232,441 |
| 2018 | $3,637 | $304,602 | $76,718 | $227,884 |
| 2017 | $3,559 | $298,630 | $75,214 | $223,416 |
| 2016 | $3,475 | $292,776 | $73,740 | $219,036 |
| 2015 | $3,424 | $288,379 | $72,633 | $215,746 |
| 2014 | $3,366 | $282,731 | $71,211 | $211,520 |
Source: Public Records
Map
Nearby Homes
- 991 Calma Dr
- 1008 Calma Dr
- 835 Cedarbend Way
- 919 Caminito Estrella
- 871 Blackwood Rd
- 607 E J St
- 945 E J St
- 1095 Winding Oak Dr
- 820 Cardamom Ct
- 664 Rainbow Dr
- 1201 Halley Ct
- 476 Montclair St
- 445 Montcalm St
- 843 Caminito Las Olas
- 466 Thrush St
- 939 Nolan Way
- 1060 Via Sinuoso
- 940 Sullivan Ct
- 1095 Paseo Entrada
- 808 Mateo St Unit 6
Your Personal Tour Guide
Ask me questions while you tour the home.