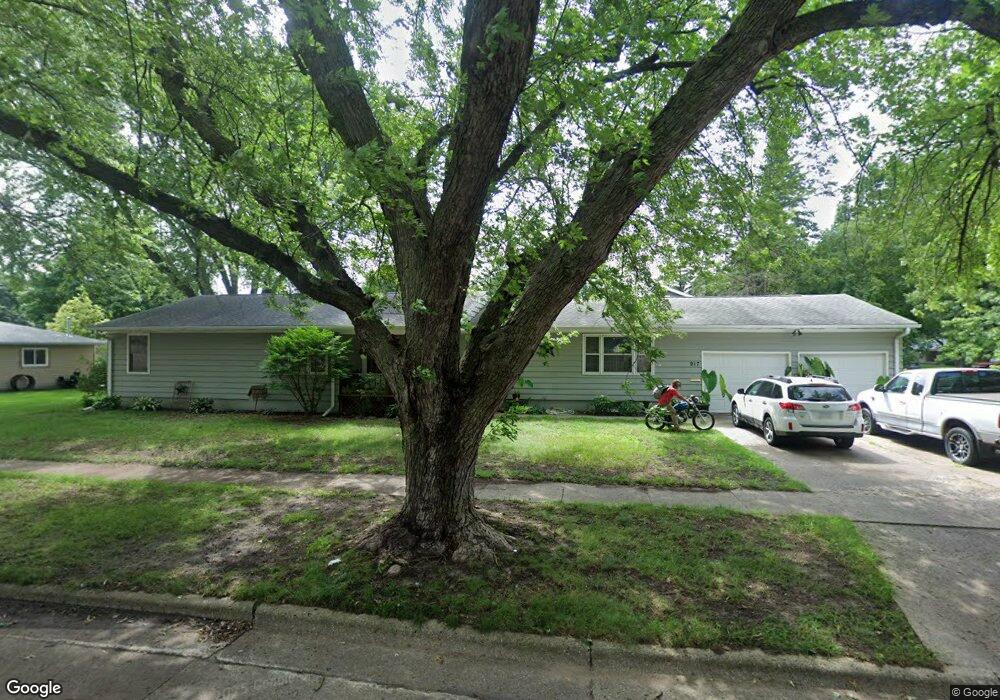
917 9th Ave W Spencer, IA 51301
Estimated Value: $266,000 - $303,000
3
Beds
2
Baths
2,064
Sq Ft
$136/Sq Ft
Est. Value
About This Home
This home is located at 917 9th Ave W, Spencer, IA 51301 and is currently estimated at $280,110, approximately $135 per square foot. 917 9th Ave W is a home located in Clay County with nearby schools including Johnson Elementary School, Fairview Park Elementary School, and Lincoln Elementary School.
Ownership History
Date
Name
Owned For
Owner Type
Purchase Details
Closed on
Oct 14, 2024
Sold by
Sand Alana L
Bought by
Sand Brian A
Current Estimated Value
Purchase Details
Closed on
Jun 20, 2013
Sold by
Howard Rodney E and Howard Patty L
Bought by
Sand Brian A and Sand Alana L
Home Financials for this Owner
Home Financials are based on the most recent Mortgage that was taken out on this home.
Original Mortgage
$187,500
Interest Rate
3.62%
Mortgage Type
New Conventional
Purchase Details
Closed on
Sep 28, 2005
Sold by
Nelson Glenn L
Bought by
Root Harlan Wayne and Root Sharon Lynn
Home Financials for this Owner
Home Financials are based on the most recent Mortgage that was taken out on this home.
Original Mortgage
$65,000
Interest Rate
5.93%
Mortgage Type
New Conventional
Create a Home Valuation Report for This Property
The Home Valuation Report is an in-depth analysis detailing your home's value as well as a comparison with similar homes in the area
Home Values in the Area
Average Home Value in this Area
Purchase History
| Date | Buyer | Sale Price | Title Company |
|---|---|---|---|
| Sand Brian A | -- | None Listed On Document | |
| Sand Brian A | -- | None Listed On Document | |
| Sand Brian A | -- | None Listed On Document | |
| Sand Brian A | $184,000 | None Available | |
| Root Harlan Wayne | $115,000 | None Available |
Source: Public Records
Mortgage History
| Date | Status | Borrower | Loan Amount |
|---|---|---|---|
| Previous Owner | Sand Brian A | $187,500 | |
| Previous Owner | Root Harlan Wayne | $65,000 |
Source: Public Records
Tax History Compared to Growth
Tax History
| Year | Tax Paid | Tax Assessment Tax Assessment Total Assessment is a certain percentage of the fair market value that is determined by local assessors to be the total taxable value of land and additions on the property. | Land | Improvement |
|---|---|---|---|---|
| 2025 | $3,924 | $281,370 | $38,050 | $243,320 |
| 2024 | $3,924 | $255,280 | $30,440 | $224,840 |
| 2023 | $3,786 | $255,280 | $30,440 | $224,840 |
| 2022 | $3,588 | $225,090 | $30,440 | $194,650 |
| 2021 | $3,632 | $209,790 | $30,440 | $179,350 |
| 2020 | $3,632 | $201,400 | $28,540 | $172,860 |
| 2019 | $3,476 | $198,030 | $0 | $0 |
| 2018 | $3,420 | $198,030 | $0 | $0 |
| 2017 | $3,420 | $192,410 | $0 | $0 |
| 2016 | $3,446 | $192,410 | $0 | $0 |
| 2015 | $2,752 | $155,490 | $0 | $0 |
| 2014 | $2,752 | $155,490 | $0 | $0 |
Source: Public Records
Map
Nearby Homes