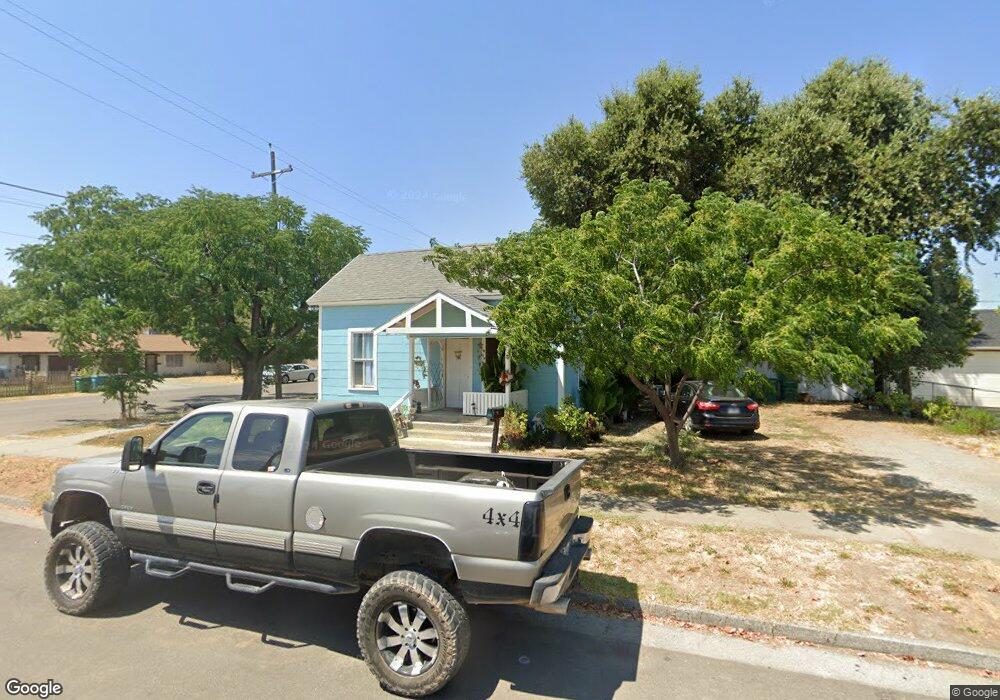
918 5th St Corning, CA 96021
Estimated Value: $124,000 - $171,556
2
Beds
1
Bath
754
Sq Ft
$199/Sq Ft
Est. Value
About This Home
This home is located at 918 5th St, Corning, CA 96021 and is currently estimated at $149,889, approximately $198 per square foot. 918 5th St is a home located in Tehama County with nearby schools including West Street Elementary School, Maywood Middle School, and Corning High School.
Ownership History
Date
Name
Owned For
Owner Type
Purchase Details
Closed on
Oct 12, 2011
Sold by
Patterson Arthur G and Patterson Vicki R
Bought by
Castrejon Julian and Castrejon Josefina
Current Estimated Value
Home Financials for this Owner
Home Financials are based on the most recent Mortgage that was taken out on this home.
Original Mortgage
$48,000
Outstanding Balance
$32,659
Interest Rate
4.05%
Mortgage Type
Seller Take Back
Estimated Equity
$117,230
Purchase Details
Closed on
Jun 8, 2010
Sold by
Williams Diana K and Williams Todd Michael
Bought by
Patterson Arthur G and Patterson Vicki R
Purchase Details
Closed on
Sep 4, 2009
Sold by
Patterson Arthur G and Patterson Vicki R
Bought by
Williams Diana K and Williams Todd Michael
Home Financials for this Owner
Home Financials are based on the most recent Mortgage that was taken out on this home.
Original Mortgage
$59,000
Interest Rate
5.2%
Mortgage Type
Seller Take Back
Create a Home Valuation Report for This Property
The Home Valuation Report is an in-depth analysis detailing your home's value as well as a comparison with similar homes in the area
Purchase History
| Date | Buyer | Sale Price | Title Company |
|---|---|---|---|
| Castrejon Julian | $53,000 | Northern California Title Co | |
| Patterson Arthur G | $62,390 | Northern California Title Co | |
| Williams Diana K | $67,000 | Northern California Title Co |
Source: Public Records
Mortgage History
| Date | Status | Borrower | Loan Amount |
|---|---|---|---|
| Open | Castrejon Julian | $48,000 | |
| Previous Owner | Williams Diana K | $59,000 |
Source: Public Records
Tax History
| Year | Tax Paid | Tax Assessment Tax Assessment Total Assessment is a certain percentage of the fair market value that is determined by local assessors to be the total taxable value of land and additions on the property. | Land | Improvement |
|---|---|---|---|---|
| 2025 | $692 | $66,559 | $31,394 | $35,165 |
| 2023 | $679 | $63,976 | $30,176 | $33,800 |
| 2022 | $669 | $62,723 | $29,585 | $33,138 |
| 2021 | $644 | $61,494 | $29,005 | $32,489 |
| 2020 | $651 | $60,864 | $28,708 | $32,156 |
| 2019 | $625 | $59,672 | $28,146 | $31,526 |
| 2018 | $626 | $58,503 | $27,595 | $30,908 |
| 2017 | $622 | $57,356 | $27,054 | $30,302 |
| 2016 | $580 | $56,232 | $26,524 | $29,708 |
| 2015 | -- | $55,388 | $26,126 | $29,262 |
| 2014 | $566 | $54,304 | $25,615 | $28,689 |
Source: Public Records
Map
Nearby Homes
Your Personal Tour Guide
Ask me questions while you tour the home.