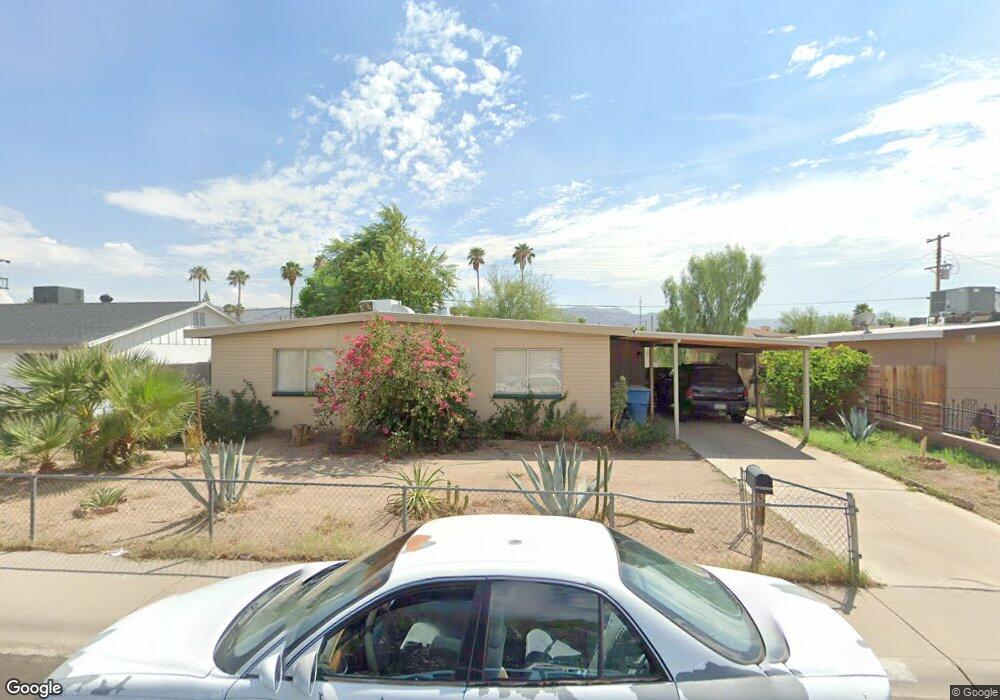
919 E Carson Rd Phoenix, AZ 85042
South Mountain NeighborhoodEstimated Value: $268,259 - $330,000
3
Beds
2
Baths
1,070
Sq Ft
$281/Sq Ft
Est. Value
About This Home
This home is located at 919 E Carson Rd, Phoenix, AZ 85042 and is currently estimated at $300,565, approximately $280 per square foot. 919 E Carson Rd is a home located in Maricopa County with nearby schools including John F. Kennedy Elementary School, C O Greenfield School, and South Mountain High School.
Ownership History
Date
Name
Owned For
Owner Type
Purchase Details
Closed on
Sep 1, 2010
Sold by
Betancourt Andres
Bought by
Betancourt Andres and Betancourt Aurelia
Current Estimated Value
Purchase Details
Closed on
Jan 28, 2010
Sold by
Betancourt Aurelia
Bought by
Betancourt Andres
Home Financials for this Owner
Home Financials are based on the most recent Mortgage that was taken out on this home.
Original Mortgage
$42,500
Outstanding Balance
$27,958
Interest Rate
4.91%
Mortgage Type
New Conventional
Estimated Equity
$272,607
Purchase Details
Closed on
Jul 29, 2009
Sold by
Paredes Liliana
Bought by
Dorsey Crossing Llc
Purchase Details
Closed on
Dec 18, 2006
Sold by
Paredes Jesus
Bought by
Paredes Liliana
Home Financials for this Owner
Home Financials are based on the most recent Mortgage that was taken out on this home.
Original Mortgage
$140,800
Interest Rate
6.33%
Mortgage Type
New Conventional
Purchase Details
Closed on
Jul 11, 2005
Sold by
Paredes Olivia Maria
Bought by
Paredes Jesus
Home Financials for this Owner
Home Financials are based on the most recent Mortgage that was taken out on this home.
Original Mortgage
$29,000
Interest Rate
5.51%
Mortgage Type
Stand Alone Second
Purchase Details
Closed on
Jun 14, 2005
Sold by
Eighteen Investments Inc
Bought by
Paredes Jesus
Home Financials for this Owner
Home Financials are based on the most recent Mortgage that was taken out on this home.
Original Mortgage
$29,000
Interest Rate
5.51%
Mortgage Type
Stand Alone Second
Purchase Details
Closed on
Apr 11, 2005
Sold by
Revest Inc
Bought by
Eighteen Investments Inc
Home Financials for this Owner
Home Financials are based on the most recent Mortgage that was taken out on this home.
Original Mortgage
$97,722
Interest Rate
5.77%
Mortgage Type
New Conventional
Purchase Details
Closed on
Mar 4, 2005
Sold by
Palomo Benjamin
Bought by
Palomo Esther Roseann
Home Financials for this Owner
Home Financials are based on the most recent Mortgage that was taken out on this home.
Original Mortgage
$97,722
Interest Rate
5.77%
Mortgage Type
New Conventional
Purchase Details
Closed on
Mar 3, 2005
Sold by
Palomo Esther Roseann and Palomo Bobby
Bought by
Revest Inc
Home Financials for this Owner
Home Financials are based on the most recent Mortgage that was taken out on this home.
Original Mortgage
$97,722
Interest Rate
5.77%
Mortgage Type
New Conventional
Purchase Details
Closed on
Dec 17, 2004
Sold by
Palomo Esther Roseann
Bought by
Revest Inc
Create a Home Valuation Report for This Property
The Home Valuation Report is an in-depth analysis detailing your home's value as well as a comparison with similar homes in the area
Home Values in the Area
Average Home Value in this Area
Purchase History
| Date | Buyer | Sale Price | Title Company |
|---|---|---|---|
| Betancourt Andres | -- | Accommodation | |
| Betancourt Andres | -- | The Talon Group Tempe Supers | |
| Betancourt Andres | $48,000 | The Talon Group Tempe Supers | |
| Dorsey Crossing Llc | $25,501 | None Available | |
| Paredes Liliana | $176,000 | Great Western Title Agency | |
| Paredes Jesus | -- | Stewart Title & Trust Of Pho | |
| Paredes Jesus | $145,000 | Stewart Title & Trust Of Pho | |
| Eighteen Investments Inc | $81,750 | North American Title Co | |
| Palomo Esther Roseann | -- | -- | |
| Revest Inc | $20,000 | -- | |
| Revest Inc | -- | -- | |
| Revest Inc | $500 | -- |
Source: Public Records
Mortgage History
| Date | Status | Borrower | Loan Amount |
|---|---|---|---|
| Open | Betancourt Andres | $42,500 | |
| Previous Owner | Paredes Liliana | $140,800 | |
| Previous Owner | Paredes Jesus | $29,000 | |
| Previous Owner | Paredes Jesus | $116,000 | |
| Previous Owner | Paredes Jesus | $116,000 | |
| Previous Owner | Eighteen Investments Inc | $97,722 |
Source: Public Records
Tax History
| Year | Tax Paid | Tax Assessment Tax Assessment Total Assessment is a certain percentage of the fair market value that is determined by local assessors to be the total taxable value of land and additions on the property. | Land | Improvement |
|---|---|---|---|---|
| 2025 | $657 | $4,357 | -- | -- |
| 2024 | $622 | $4,150 | -- | -- |
| 2023 | $622 | $19,930 | $3,980 | $15,950 |
| 2022 | $609 | $15,520 | $3,100 | $12,420 |
| 2021 | $622 | $13,630 | $2,720 | $10,910 |
| 2020 | $614 | $12,930 | $2,580 | $10,350 |
| 2019 | $594 | $10,320 | $2,060 | $8,260 |
| 2018 | $578 | $9,660 | $1,930 | $7,730 |
| 2017 | $551 | $7,130 | $1,420 | $5,710 |
| 2016 | $524 | $5,770 | $1,150 | $4,620 |
| 2015 | $493 | $4,500 | $900 | $3,600 |
Source: Public Records
Map
Nearby Homes
- 913 E Fremont Rd Unit 1
- 825 E Minton St
- 819 E Apollo Rd
- 6630 S 11th St Unit 1
- 1329 E Irwin Ave
- 333 E Carter Rd
- 6410 S 7th St
- 7312 S 13th Way
- 1317 E Fremont Rd
- 849 E Constance Way
- 7527 S 13th Place
- 916 E Harwell Rd
- 7514 S 14th St
- 1322 E Harwell Rd
- 836 E Gary Ln
- 907 E Gary Ln
- 1507 E Apollo Rd
- 7611 S 15th St
- 1515 E Apollo Rd
- 1516 E Fremont Rd
- 913 E Carson Rd
- 923 E Carson Rd
- 920 E Carter Rd
- 914 E Carter Rd
- 924 E Carter Rd
- 907 E Carson Rd
- 927 E Carson Rd
- 920 E Carson Rd
- 914 E Carson Rd
- 924 E Carson Rd
- 908 E Carter Rd
- 928 E Carter Rd
- 908 E Carson Rd
- 928 E Carson Rd
- 901 E Carson Rd
- 933 E Carson Rd
- 902 E Carter Rd
- 934 E Carter Rd
- 902 E Carson Rd
- 934 E Carson Rd
Your Personal Tour Guide
Ask me questions while you tour the home.