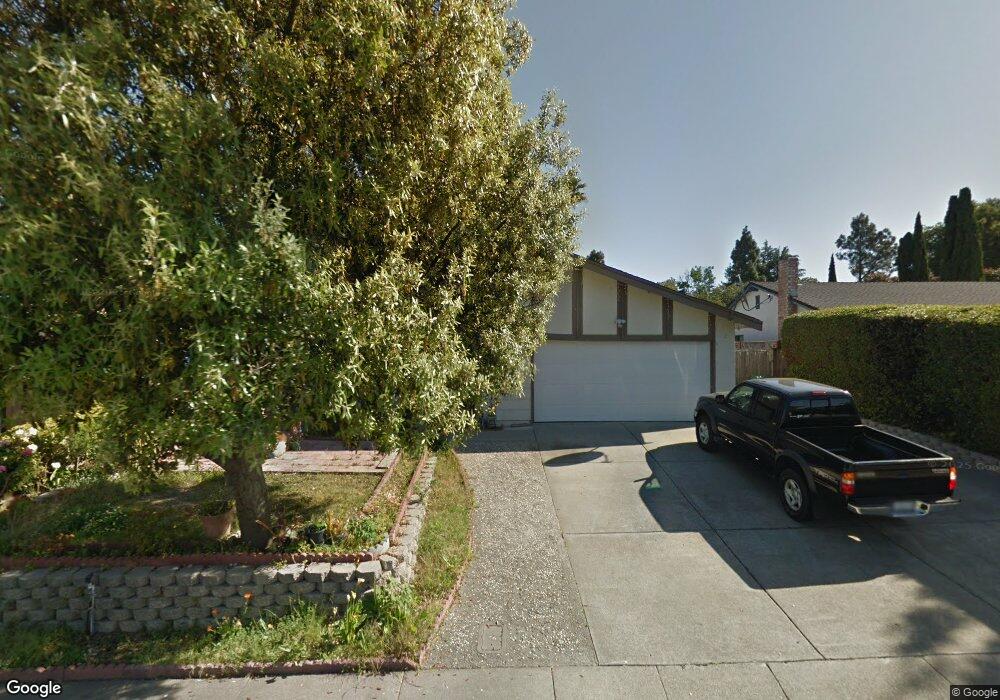
919 Sandy Cove Dr Rodeo, CA 94572
View Pointe NeighborhoodEstimated Value: $785,792 - $821,000
4
Beds
3
Baths
2,103
Sq Ft
$380/Sq Ft
Est. Value
About This Home
This home is located at 919 Sandy Cove Dr, Rodeo, CA 94572 and is currently estimated at $798,698, approximately $379 per square foot. 919 Sandy Cove Dr is a home located in Contra Costa County with nearby schools including Rodeo Hills Elementary School, Carquinez Middle School, and John Swett High School.
Ownership History
Date
Name
Owned For
Owner Type
Purchase Details
Closed on
Oct 28, 2024
Sold by
Lee King K and Lee Phochana
Bought by
Lee Family Revocable Trust and Lee
Current Estimated Value
Purchase Details
Closed on
Oct 15, 2002
Sold by
Osullivan Magdalena
Bought by
Lee King K and Lee Phochana
Home Financials for this Owner
Home Financials are based on the most recent Mortgage that was taken out on this home.
Original Mortgage
$300,700
Interest Rate
6.09%
Mortgage Type
Purchase Money Mortgage
Purchase Details
Closed on
Aug 15, 2001
Sold by
Osullivan Magdalena
Bought by
Osullivan Magdalena
Home Financials for this Owner
Home Financials are based on the most recent Mortgage that was taken out on this home.
Original Mortgage
$74,000
Interest Rate
7.21%
Mortgage Type
Purchase Money Mortgage
Purchase Details
Closed on
Oct 6, 1993
Sold by
Osullivan Donald J
Bought by
Osullivan Magdalena
Create a Home Valuation Report for This Property
The Home Valuation Report is an in-depth analysis detailing your home's value as well as a comparison with similar homes in the area
Home Values in the Area
Average Home Value in this Area
Purchase History
| Date | Buyer | Sale Price | Title Company |
|---|---|---|---|
| Lee Family Revocable Trust | -- | None Listed On Document | |
| Lee King K | $400,000 | North American Title | |
| Osullivan Magdalena | -- | New Century Title Company | |
| Osullivan Magdalena | -- | -- |
Source: Public Records
Mortgage History
| Date | Status | Borrower | Loan Amount |
|---|---|---|---|
| Previous Owner | Lee King K | $300,700 | |
| Previous Owner | Osullivan Magdalena | $74,000 |
Source: Public Records
Tax History
| Year | Tax Paid | Tax Assessment Tax Assessment Total Assessment is a certain percentage of the fair market value that is determined by local assessors to be the total taxable value of land and additions on the property. | Land | Improvement |
|---|---|---|---|---|
| 2025 | $7,998 | $579,162 | $231,575 | $347,587 |
| 2024 | $7,783 | $567,807 | $227,035 | $340,772 |
| 2023 | $7,783 | $556,675 | $222,584 | $334,091 |
| 2022 | $7,659 | $545,761 | $218,220 | $327,541 |
| 2021 | $7,508 | $535,061 | $213,942 | $321,119 |
| 2019 | $7,549 | $519,194 | $207,598 | $311,596 |
| 2018 | $7,337 | $509,015 | $203,528 | $305,487 |
| 2017 | $7,016 | $483,000 | $193,126 | $289,874 |
| 2016 | $6,142 | $444,000 | $177,532 | $266,468 |
| 2015 | $5,728 | $405,000 | $161,939 | $243,061 |
| 2014 | $5,247 | $361,000 | $144,345 | $216,655 |
Source: Public Records
Map
Nearby Homes
- 938 Sandy Cove Dr
- 922 Coral Dr
- 900 Seascape Cir
- 797 Coral Ridge Cir
- 120 Bonita Ct
- 405 Weymouth
- 802 Dover
- 801 Dover
- 704 Windsor Unit 704
- 1101 Chelsea
- 836 Hawthorne Dr
- 1334 7th St
- 176 Bedford
- 11 Fallen Leaf Ct
- 1012 Salt Spray Terrace
- 106 White Cap Cove
- 343 Rodeo Ave
- 511 Third St
- 715 Mariposa Ave
- 205 Pacific Ave Unit 213
- 925 Sandy Cove Dr
- 913 Sandy Cove Dr
- 931 Sandy Cove Dr
- 907 Sandy Cove Dr
- 937 Sandy Cove Dr
- 926 Sandy Cove Dr
- 914 Sandy Cove Dr
- 920 Sandy Cove Dr
- 903 Sandy Cove Dr
- 932 Sandy Cove Dr
- 908 Sandy Cove Dr
- 1032 Baypoint Way
- 1030 Baypoint Way
- 901 Sandy Cove Dr
- 1034 Baypoint Way
- 902 Sandy Cove Dr
- 1070 Sandpoint Dr
- 1028 Baypoint Way
- 1072 Sandpoint Dr
- 895 Coral Dr
Your Personal Tour Guide
Ask me questions while you tour the home.