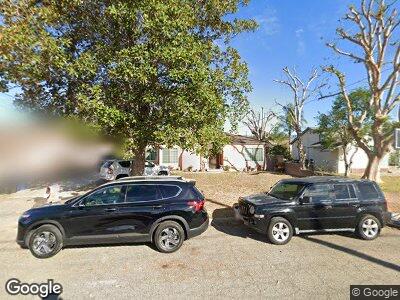
919 W F St Colton, CA 92324
Estimated Value: $457,000 - $508,000
2
Beds
2
Baths
1,503
Sq Ft
$327/Sq Ft
Est. Value
About This Home
This home is located at 919 W F St, Colton, CA 92324 and is currently estimated at $491,179, approximately $326 per square foot. 919 W F St is a home located in San Bernardino County with nearby schools including Paul Rogers Elementary School, Colton Middle School, and Colton High School.
Ownership History
Date
Name
Owned For
Owner Type
Purchase Details
Closed on
Feb 9, 1998
Sold by
Hud
Bought by
Gilberto D Silvia L and Delgado Silvia L
Current Estimated Value
Home Financials for this Owner
Home Financials are based on the most recent Mortgage that was taken out on this home.
Original Mortgage
$77,362
Interest Rate
7.07%
Mortgage Type
FHA
Purchase Details
Closed on
Jun 27, 1997
Sold by
Citicorp Mtg Inc
Bought by
Hud
Purchase Details
Closed on
Jun 23, 1997
Sold by
Flattery Michael D and Mclarty Flattery Jul
Bought by
Citicorp Mtg Inc and Citicorp Homeowners Services Inc
Create a Home Valuation Report for This Property
The Home Valuation Report is an in-depth analysis detailing your home's value as well as a comparison with similar homes in the area
Home Values in the Area
Average Home Value in this Area
Purchase History
| Date | Buyer | Sale Price | Title Company |
|---|---|---|---|
| Gilberto D Silvia L | $78,000 | American Title | |
| Hud | -- | First Southwestern Title Co | |
| Citicorp Mtg Inc | $86,066 | First Southwestern Title Co |
Source: Public Records
Mortgage History
| Date | Status | Borrower | Loan Amount |
|---|---|---|---|
| Open | Delgado Silvia L | $15,000 | |
| Previous Owner | Gilberto D Silvia L | $77,362 |
Source: Public Records
Tax History Compared to Growth
Tax History
| Year | Tax Paid | Tax Assessment Tax Assessment Total Assessment is a certain percentage of the fair market value that is determined by local assessors to be the total taxable value of land and additions on the property. | Land | Improvement |
|---|---|---|---|---|
| 2024 | $3,975 | $119,883 | $30,738 | $89,145 |
| 2023 | $3,972 | $117,532 | $30,135 | $87,397 |
| 2022 | $3,946 | $115,227 | $29,544 | $85,683 |
| 2021 | $3,967 | $112,968 | $28,965 | $84,003 |
| 2020 | $3,967 | $111,810 | $28,668 | $83,142 |
| 2019 | $3,928 | $109,618 | $28,106 | $81,512 |
| 2018 | $3,747 | $107,469 | $27,555 | $79,914 |
| 2017 | $3,659 | $105,362 | $27,015 | $78,347 |
| 2016 | $3,660 | $103,296 | $26,485 | $76,811 |
| 2015 | $1,261 | $101,744 | $26,087 | $75,657 |
| 2014 | $1,211 | $99,751 | $25,576 | $74,175 |
Source: Public Records
Map
Nearby Homes