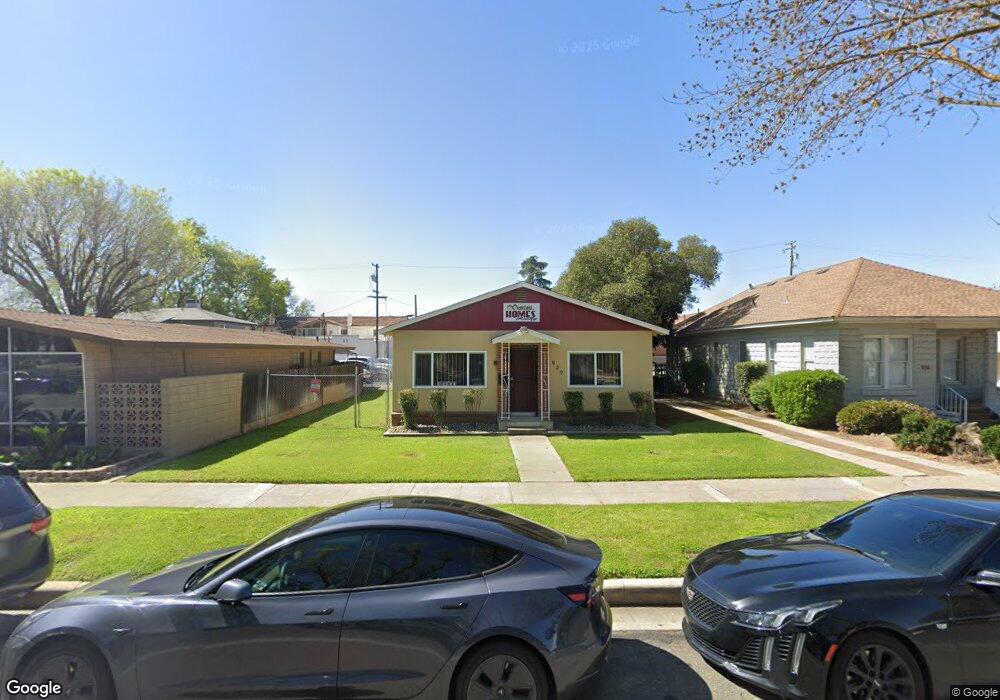
920 W 18th St Merced, CA 95340
Downtown Merced NeighborhoodEstimated Value: $259,049
--
Bed
--
Bath
--
Sq Ft
7,405
Sq Ft Lot
About This Home
This home is located at 920 W 18th St, Merced, CA 95340 and is currently estimated at $259,049. 920 W 18th St is a home located in Merced County with nearby schools including Fremont Elementary School, Herbert Hoover Middle School, and Merced High School.
Ownership History
Date
Name
Owned For
Owner Type
Purchase Details
Closed on
Mar 17, 2019
Sold by
Kaley James D and Kaley Julie M
Bought by
J & J Kaley Llc
Current Estimated Value
Purchase Details
Closed on
Apr 4, 2008
Sold by
Meeusen Joseph W and Meeusen Laurelyn K
Bought by
Kaley James D and Kaley Julie M
Home Financials for this Owner
Home Financials are based on the most recent Mortgage that was taken out on this home.
Original Mortgage
$82,500
Interest Rate
5.8%
Mortgage Type
Commercial
Create a Home Valuation Report for This Property
The Home Valuation Report is an in-depth analysis detailing your home's value as well as a comparison with similar homes in the area
Home Values in the Area
Average Home Value in this Area
Purchase History
| Date | Buyer | Sale Price | Title Company |
|---|---|---|---|
| J & J Kaley Llc | -- | None Available | |
| Kaley James D | $110,000 | Transcounty Title Company |
Source: Public Records
Mortgage History
| Date | Status | Borrower | Loan Amount |
|---|---|---|---|
| Previous Owner | Kaley James D | $82,500 |
Source: Public Records
Tax History Compared to Growth
Tax History
| Year | Tax Paid | Tax Assessment Tax Assessment Total Assessment is a certain percentage of the fair market value that is determined by local assessors to be the total taxable value of land and additions on the property. | Land | Improvement |
|---|---|---|---|---|
| 2025 | $2,198 | $147,071 | $91,938 | $55,133 |
| 2024 | $2,198 | $144,675 | $90,136 | $54,539 |
| 2023 | $2,175 | $141,623 | $88,369 | $53,254 |
| 2022 | $1,633 | $139,540 | $86,637 | $52,903 |
| 2021 | $1,627 | $136,563 | $84,939 | $51,624 |
| 2020 | $1,650 | $136,231 | $84,069 | $52,162 |
| 2019 | $1,623 | $133,267 | $82,421 | $50,846 |
| 2018 | $1,494 | $131,068 | $80,805 | $50,263 |
| 2017 | $1,551 | $128,889 | $79,221 | $49,668 |
| 2016 | $1,564 | $129,573 | $77,668 | $51,905 |
| 2015 | $1,543 | $127,741 | $76,502 | $51,239 |
| 2014 | $1,513 | $125,387 | $75,004 | $50,383 |
Source: Public Records
Map
Nearby Homes